13 - 18 OCTOBER 2013, ATLANTA, GEORGIA, USA


The goal of the workshop is to bring together world-class public health and information visualization experts and curious learners to discuss how the fields can come together to generate new tools for emerging and longstanding public health problems. Public health is charged with assessing current and emerging health threats and issues, developing effective population-based policies and interventions to address these problems, and monitoring delivery and outcomes of public health actions. Many public health problems, such as the obesity epidemic, HIV/STI transmission, and environmental hazards are called "wicked" due to their complexity and multi-layered causal factors at individual, group, and social levels (Kreuter, 2004). To make decisions about when and where to deploy resources that produce the greatest net benefits in complex or rapidly evolving situations, public health practitioners need new tools to integrate multiple sources of data from formal disease surveillance systems, secondary sources of geographic and demographic data, and new data streams such as real-time social media content. We invite original research, case studies/practice reports, systematic reviews, evaluation studies, methodology innovations, or commentary on the following topics of specific interest, while welcoming work on all aspects of public health and information visualization. See the workshop's website for more information.
At this workshop that recaps the 2013 VAST Challenge, challenge organizers, participants, and conference attendees come together to discuss their work on this year’s Challenge. The workshop will feature sessions dedicated to each of the three mini-challenges. All of the 2013 honorees will present their winning submissions. In addition, the meeting will feature a poster session, a participant feedback session, and a look forward to the 2014 competition. This workshop is open to all IEEE VIS attendees.
The list of papers and the agenda can be found HERE.
The hardware complexity of HPC systems has increased in parallel with the complexity of modern simulation and scale-bridging applications. Consequently, writing efficient software for these large- scale systems has become increasingly difficult. Understanding the interactions of hardware and software and their impacts on scalability in the presence of large numbers of compute cores is essential for optimizing HPC systems. However, in many cases it is simply too difficult to comprehend performance characteristics. The purpose of this workshop is to cross-pollinate the expertise of specialists in performance analysis and visualization. By facilitating the beginning of significant collaborations between these groups we hope to connect those already working in the development of performance tools with those working in the visualization of software performance at all scales.
Much research has been reported on visual text analytics for plain text documents viewed in traditional analytic settings. In this workshop, we would like to push the boundary of visual text analytics toward heterogeneous textual data (text associated with other data types) and ubiquitous text analytics. First, we would like to use the workshop to collect various use cases about heterogeneous data and ubiquitous text analytics. From the use cases, we hope to better understand the requirements of heterogeneous textual data analysis from a task-driven perspective. Second, based on the use cases, we would like to use this workshop to examine how to best leverage state-of-the-art text analytics and traditional data mining techniques in conjunction with novel interactive visual analytics to address the challenges manifested by the collected use cases.
Few areas involve, generate, and celebrate data in the manner that sports does. The field of sports analytics is primarily associated with baseball, but has more recently spread to other sports, including basketball, soccer, professional football, ice hockey, tennis, and golf. Surprisingly, there have been few applications of visualization presentation and exploration tools to sports data. This workshop will serve as the first meeting of researchers and practitioners interested in presenting sports data through visualization. It will provide an opportunity for those engaged in this topic to interact and share their experiences. Hopefully, it will spur growth in a new sub-area of data visualization for the future.
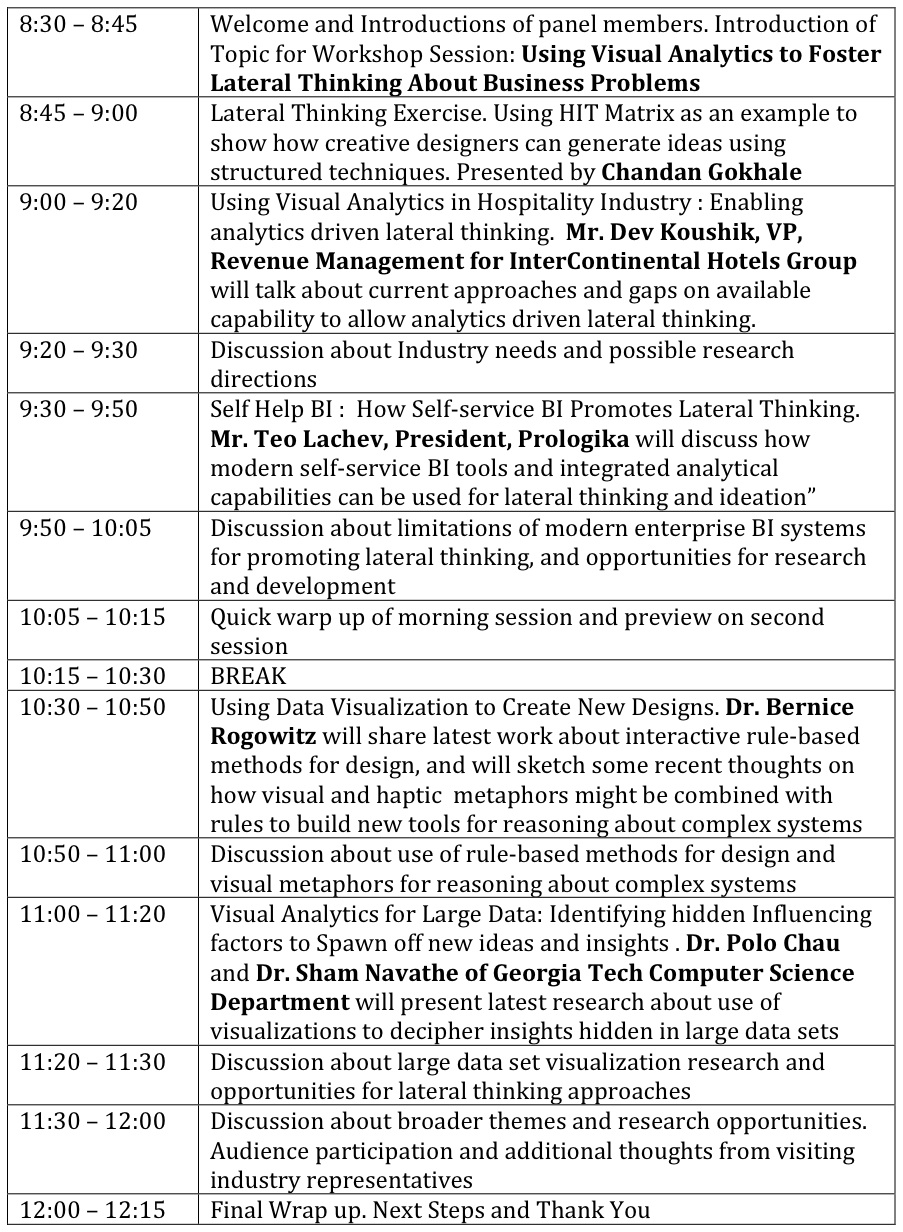
Lateral thinking (also called divergent thinking) is a critical part of the sensemaking process. Moreover, researchers in the field of Visual Analytics have recognized that iterative and sequential rounds of ‘Convergent Thinking’ and ‘Lateral Thinking’ are necessary for arriving at the most insightful observations. The same pattern is at the heart of ‘Design Thinking’ practiced by creative professionals. The approach leads them to holistic problem solutions that exceed what could be achieved through pure a ‘Convergent Thinking’ approach. However, most of the BI and analytics systems used by business organizations include tools and interactive features (like filtering, sorting, selecting or ‘data brushing’) that are primarily ‘convergent’ in nature. There is little or no support for lateral ideation. Yet lateral thinking has a fairly well developed body of knowledge and includes easy to use techniques for developing out-of-the-box, creative design ideas. Business practitioners regularly use ideation techniques like ‘6 Hats’, ‘HIT Matrix’ and ‘BrainWriting’ to bring structure to brainstorming sessions that seek out-of-the-box business ideas. Most new design or business ideas start as a ‘sketch’ or early visualization of the idea. But there are no formal tools or techniques in commercial BI systems that allow business users to develop ‘sketches’ of alternative business scenarios though forced and controlled data experiments - just the way a ‘HIT matrix’ or ‘6 Hats’ technique does in Lateral Thinking workshops. This session will introduce a number of ideation techniques designed for lateral thinking and foster discussion around how these approaches can be leveraged in the visual analytics context. The session will bring together researchers and practitioners to think about ways this can be done, and discuss challenges and potential solutions.
As news content moves from desktop to mobile devices and the expectations of real-time information increases, audiences are beginning to seek news visualizations for their on-the-go, fast-paced lives, and to view them on a variety of devices in a variety of contexts. These have created important challenges from a visualization and content perspective that we aim to address in this cross-discipline workshop.The goals of this workshop are:
This workshop aims to attract visualization scholars, journalism theorists, journalists, user experience researchers, graphic designers, data scientists, statisticians, and programmers interested in information visualizations for news, as a way to continue the cross-discipline community that has emerged, with a new focus.
