Estimation and Visualization of Isosurface Uncertainty from Linear and High-Order Interpolation Methods
Timbwaoga A. J. Ouermi - Scientific Computing and Imaging Institute, Salk Lake City, United States
Jixian Li - University of Utah, Salt Lake City, United States
Tushar M. Athawale - Oak Ridge National Laboratory, Oak Ridge, United States
Chris R. Johnson - University of Utah, Salt Lake City, United States
Screen-reader Accessible PDF
Download preprint PDF
Room: Bayshore VI
2024-10-14T12:30:00ZGMT-0600Change your timezone on the schedule page
2024-10-14T12:30:00Z

Abstract
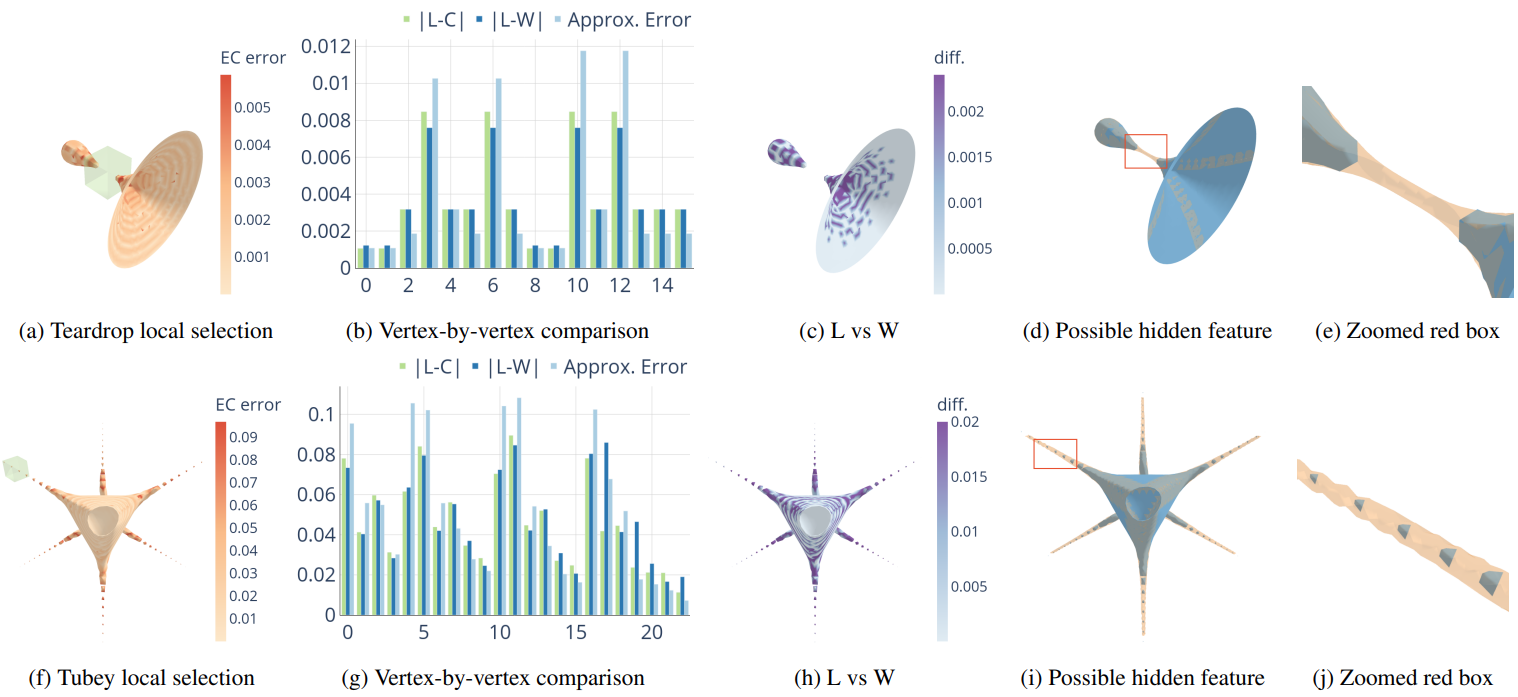
Isosurface visualization is fundamental for exploring and analyzing 3D volumetric data. Marching cubes (MC) algorithms with linear interpolation are commonly used for isosurface extraction and visualization.Although linear interpolation is easy to implement, it has limitations when the underlying data is complex and high-order, which is the case for most real-world data. Linear interpolation can output vertices at the wrong location. Its inability to deal with sharp features and features smaller than grid cells can create holes and broken pieces in the extracted isosurface. Despite these limitations, isosurface visualizations typically do not include insight into the spatial location and the magnitude of these errors. We utilize high-order interpolation methods with MC algorithms and interactive visualization to highlight these uncertainties. Our visualization tool helps identify the regions of high interpolation errors. It also allows users to query local areas for details and compare the differences between isosurfaces from different interpolation methods. In addition, we employ high-order methods to identify and reconstruct possible features that linear methods cannot detect.We showcase how our visualization tool helps explore and understand the extracted isosurface errors through synthetic and real-world data.