IEEE VIS 2024 Content: Evaluating the Impact of Power Outages on Occupancy Patterns During the 2021 Texas Power Crisis

Evaluating the Impact of Power Outages on Occupancy Patterns During the 2021 Texas Power Crisis

Andy S Berres - National Renewable Energy Laboratory, Golden, United States

Baldwin Nsonga - Institute of Computer Science, Leipzig University, Leipzig, Germany

Caitlyn Clark - National Renewable Energy Laboratory, Golden, United States

Robert Jeffers - National Renewable Energy Laboratory, Golden, United States

Hans Hagen - University of Kaiserslautern, Kaiserslautern, Germany

Gerik Scheuermann - Leipzig University, Leipzig, Germany

Room: Bayshore VI

2024-10-14T16:00:00ZGMT-0600Change your timezone on the schedule page
2024-10-14T16:00:00Z
Exemplar figure, described by caption below
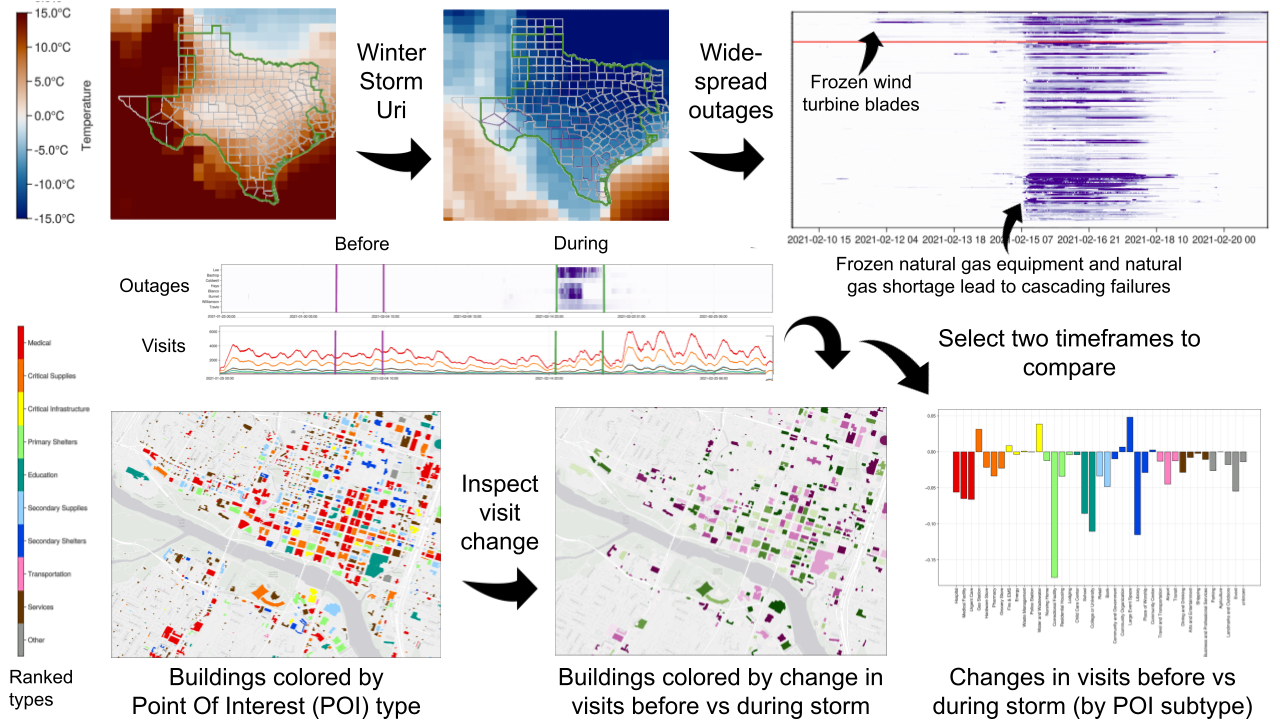
We present a visual analysis of the impact of the 2021 Texas Power Crisis on building occupancy in Austin, Texas. In February 2021, Winter Storm Uri caused temperatures to rapidly drop up to 50℉/25℃ below typical Texas winter temperatures (see comparison on the top left), and due to the isolated nature of the Texas powergrid, there was little room for compensation for the additional load and . The top right shows a heatmap comparison of power outages over time (x-axis) for different Texas counties (y-axis). The red line indicates the threshold for the 10% most affected counties (in the tool itself, hovering reveals more information about the counties and the extent of the outages). The tool provides navigation elements for users to select two timeframes they want to compare. In this case, we chose the 3 days with most intense outages, and an equivalent 3-day window two weeks prior, before the winter storm hit. The bottom shows buildings colored by POI type (for buildings with multiple POI, we chose the type with the highest importance – shown in the legend on the left). The map in the middle shows increases (green) and decreases (purple) in visits during the storm, compared with pre-storm conditions. The changes in visits/occupancy by POI subtype (colored by POI type) are shown on the bottom right. Large Event Spaces (which served as cold shelters) saw an increase in occupancy that’s just a little over the decrease in occupancy of residential homes, and the visits to correctional facilities dropped dramatically.  With the exception of the weather layer, all graphics come from MoVis, an interactive prototype we developed. To learn more about the weather impact on the power grid, see our other paper “Extreme Weather and the Power Grid: A Case Study of Winter Storm Uri.”
Fast forward
Abstract

Large-scale power outages, such as those caused by extreme weather events, have a big impact on human behavior. A short power outage is merely a nuisance for most, and may not change people's locations. An outage that lasts for a few hours can result in spoiled food and medical supplies, and people will have to restock spoiled items. Long outages result in temperatures outside tolerable levels in homes, and may prompt people to acquire supplies, such as generators and gas, or change location. The long outages during Winter Storm Uri in Texas resulted in millions of dollars in property damage due to freezing pipes. This level of damage is expected to result in a sharp increase in supply runs and contractor activity. In this paper, we present a tool to explore differences in visiting patterns before, during, and after power outages. It allows to compare different points of interest like medical facilities, grocery stores, hardware stores, and other types of businesses.