Preliminary Guidelines For Combining Data Integration and Visual Data Analysis
Adam Coscia -
Ashley Suh -
Remco Chang -
Alex Endert -
Screen-reader Accessible PDF
Download preprint PDF
DOI: 10.1109/TVCG.2023.3334513
Room: Bayshore II
2024-10-16T13:18:00ZGMT-0600Change your timezone on the schedule page
2024-10-16T13:18:00Z

Fast forward
Full Video
Keywords
Visual analytics, Data integration, User interface design, Integration strategies, Analytical behaviors.
Abstract
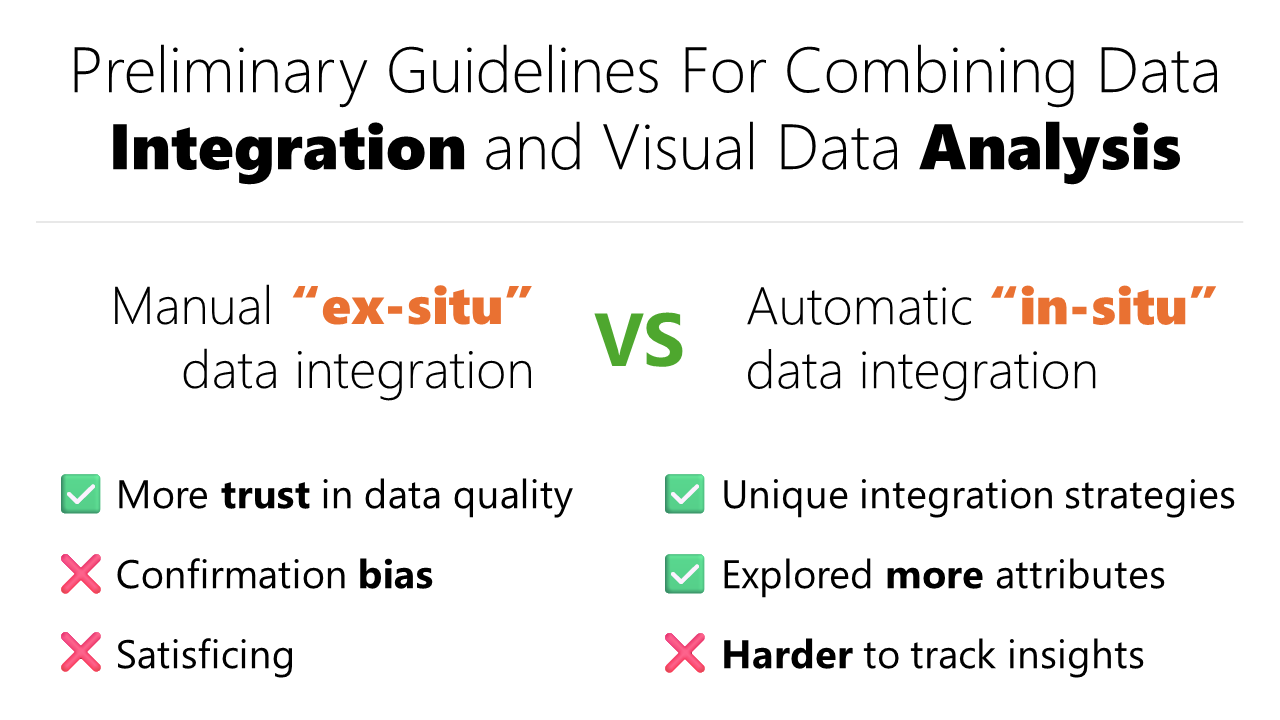
Data integration is often performed to consolidate information from multiple disparate data sources during visual data analysis. However, integration operations are usually separate from visual analytics operations such as encode and filter in both interface design and empirical research. We conducted a preliminary user study to investigate whether and how data integration should be incorporated directly into the visual analytics process. We used two interface alternatives featuring contrasting approaches to the data preparation and analysis workflow: manual file-based ex-situ integration as a separate step from visual analytics operations; and automatic UI-based in-situ integration merged with visual analytics operations. Participants were asked to complete specific and free-form tasks with each interface, browsing for patterns, generating insights, and summarizing relationships between attributes distributed across multiple files. Analyzing participants' interactions and feedback, we found both task completion time and total interactions to be similar across interfaces and tasks, as well as unique integration strategies between interfaces and emergent behaviors related to satisficing and cognitive bias. Participants' time spent and interactions revealed that in-situ integration enabled users to spend more time on analysis tasks compared with ex-situ integration. Participants' integration strategies and analytical behaviors revealed differences in interface usage for generating and tracking hypotheses and insights. With these results, we synthesized preliminary guidelines for designing future visual analytics interfaces that can support integrating attributes throughout an active analysis process.