SenseMap: Urban Performance Visualization and Analytics via Semantic Textual Similarity
Juntong Chen -
Qiaoyun Huang -
Changbo Wang -
Chenhui Li -
DOI: 10.1109/TVCG.2023.3333356
Room: Bayshore VII
2024-10-16T14:51:00ZGMT-0600Change your timezone on the schedule page
2024-10-16T14:51:00Z

Fast forward
Full Video
Keywords
Urban data, semantic textual similarity, point of interest, density map, visual analytics, visualization design
Abstract
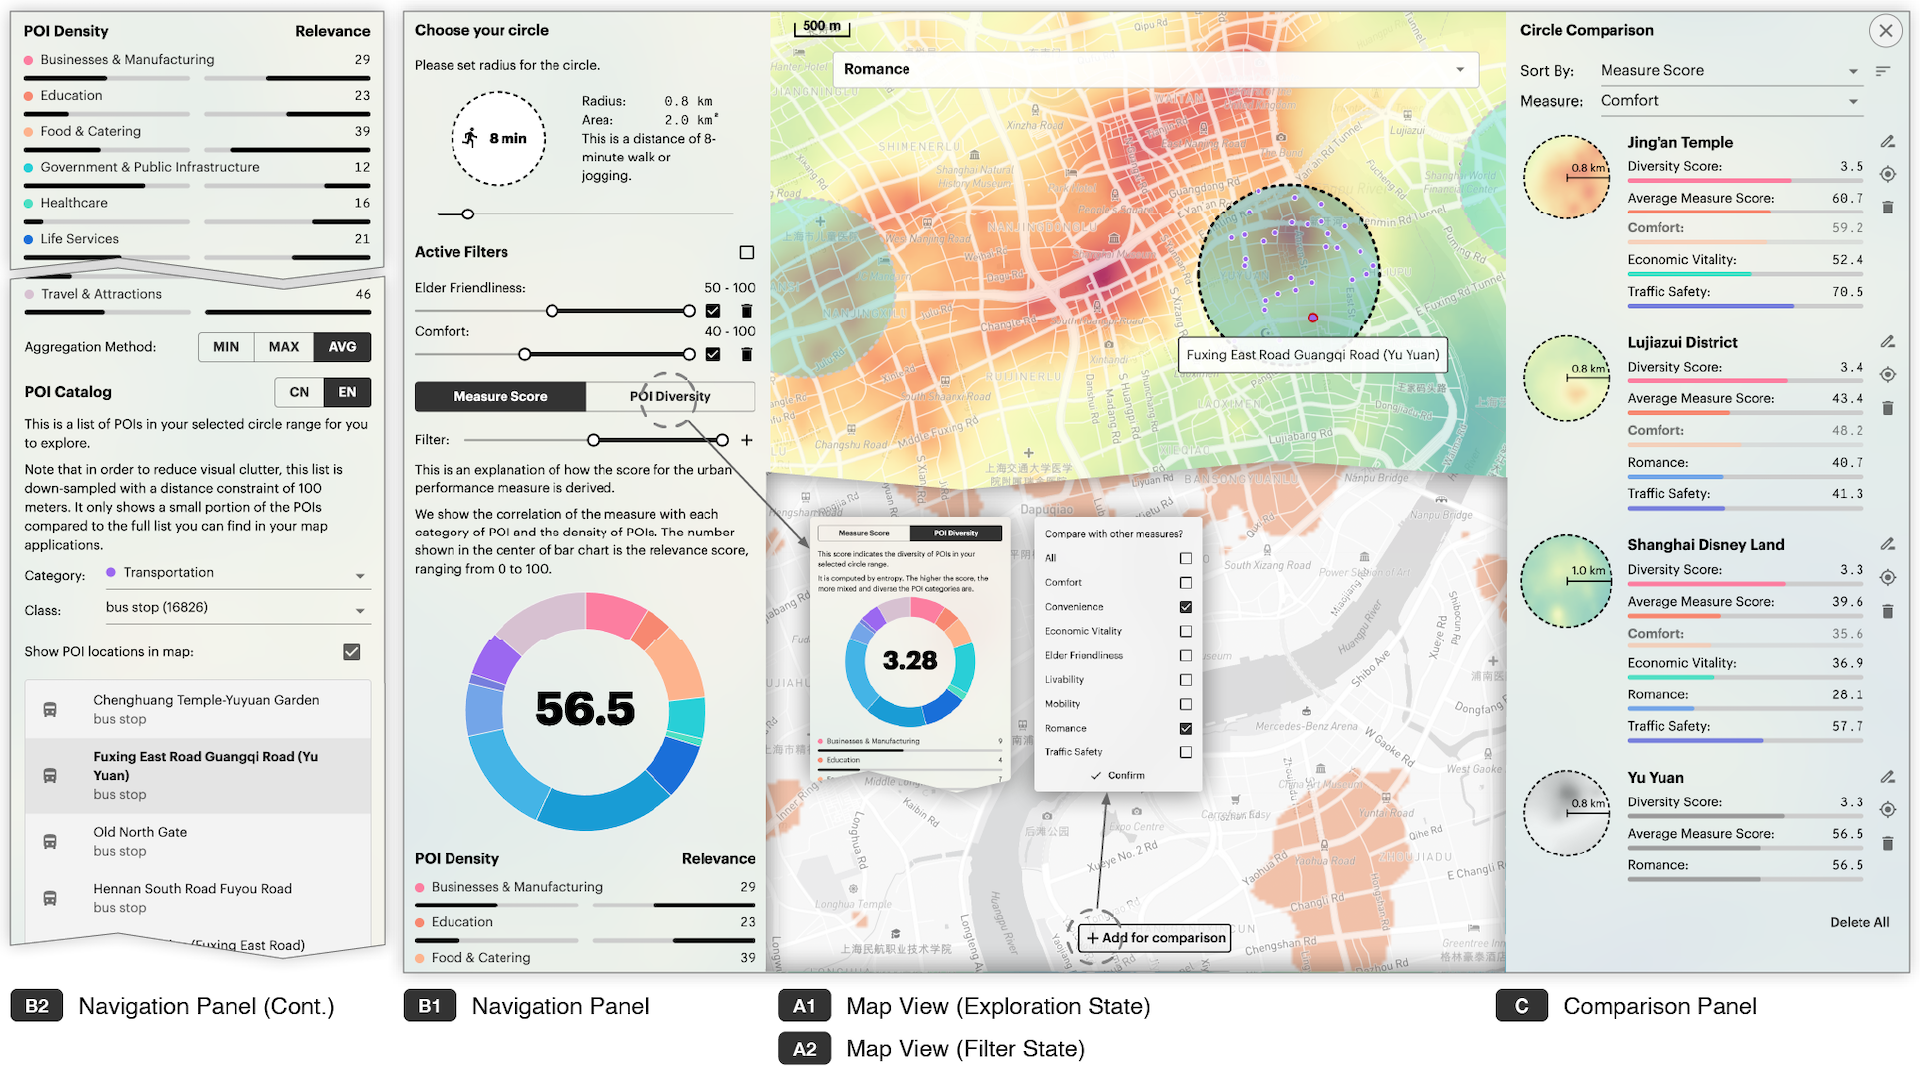
As urban populations grow, effectively accessing urban performance measures such as livability and comfort becomes increasingly important due to their significant socioeconomic impacts. While Point of Interest (POI) data has been utilized for various applications in location-based services, its potential for urban performance analytics remains unexplored. In this paper, we present SenseMap, a novel approach for analyzing urban performance by leveraging POI data as a semantic representation of urban functions. We quantify the contribution of POIs to different urban performance measures by calculating semantic textual similarities on our constructed corpus. We propose Semantic-adaptive Kernel Density Estimation which takes into account POIs’ influential areas across different Traffic Analysis Zones and semantic contributions to generate semantic density maps for measures. We design and implement a feature-rich, real-time visual analytics system for users to explore the urban performance of their surroundings. Evaluations with human judgment and reference data demonstrate the feasibility and validity of our method. Usage scenarios and user studies demonstrate the capability, usability, and explainability of our system.