Dark Mode or Light Mode? Exploring the Impact of Contrast Polarity on Visualization Performance Between Age Groups
Zack While - University of Massachusetts Amherst, Amherst, United States
Ali Sarvghad - University of Massachusetts Amherst, Amherst, United States
Download Supplemental Material
Room: Bayshore VI
2024-10-17T12:30:00ZGMT-0600Change your timezone on the schedule page
2024-10-17T12:30:00Z

Fast forward
Full Video
Keywords
people in late adulthood, GerontoVis, data visualization, contrast polarity
Abstract
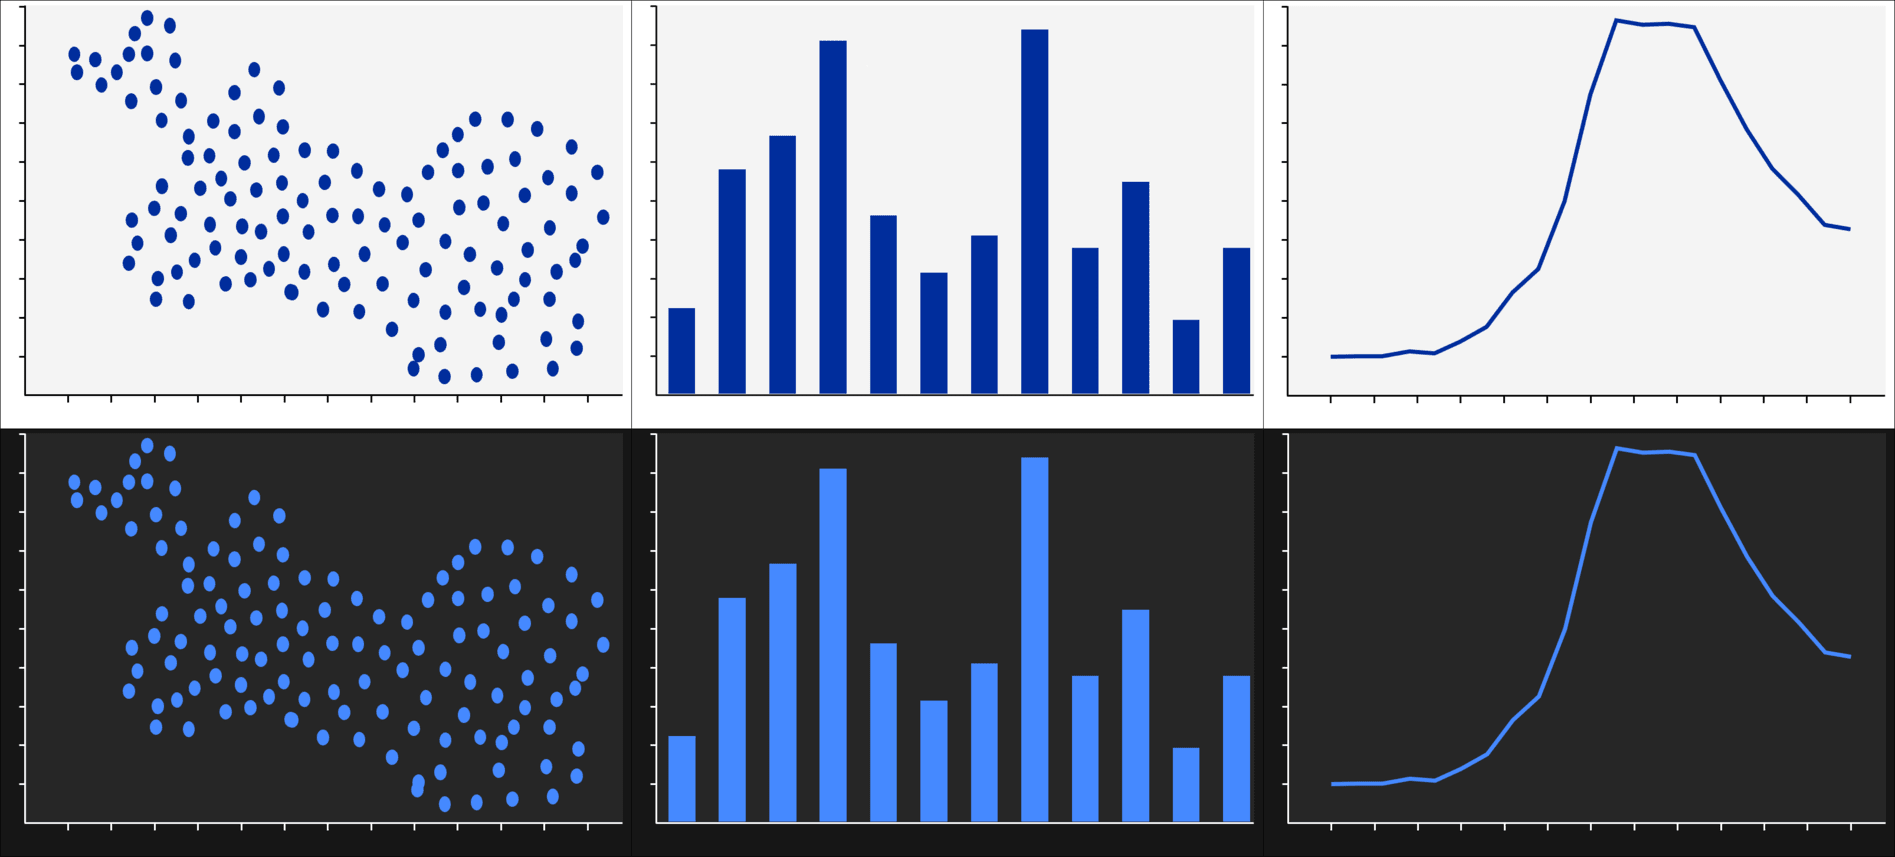
This study examines the impact of positive and negative contrast polarities (i.e., light and dark modes) on the performance of younger adults and people in their late adulthood (PLA). In a crowdsourced study with 134 participants (69 below age 60, 66 aged 60 and above), we assessed their accuracy and time performing analysis tasks across three common visualization types (Bar, Line, Scatterplot) and two contrast polarities (positive and negative). We observed that, across both age groups, the polarity that led to better performance and the resulting amount of improvement varied on an individual basis, with each polarity benefiting comparable proportions of participants. However, the contrast polarity that led to better performance did not always match their preferred polarity. Additionally, we observed that the choice of contrast polarity can have an impact on time similar to that of the choice of visualization type, resulting in an average percent difference of around 36%. These findings indicate that, overall, the effects of contrast polarity on visual analysis performance do not noticeably change with age. Furthermore, they underscore the importance of making visualizations available in both contrast polarities to better-support a broad audience with differing needs. Supplementary materials for this work can be found at https://osf.io/539a4/.