Demystifying Spatial Dependence: Interactive Visualizations for Interpreting Local Spatial Autocorrelation
Lee Mason - NIH, Rockville, United States. Queen's University, Belfast, United Kingdom
Blánaid Hicks - Queen's University Belfast , Belfast , United Kingdom
Jonas S Almeida - National Institutes of Health, Rockville, United States
Download preprint PDF
Download Supplemental Material
Room: Bayshore VI
2024-10-17T16:36:00ZGMT-0600Change your timezone on the schedule page
2024-10-17T16:36:00Z

Fast forward
Full Video
Keywords
Spatial, spatial clustering, spatial autocorrelation, geospatial, GIS, interactive visualization, visual analytics, Moran's I, local indicators of spatial association
Abstract
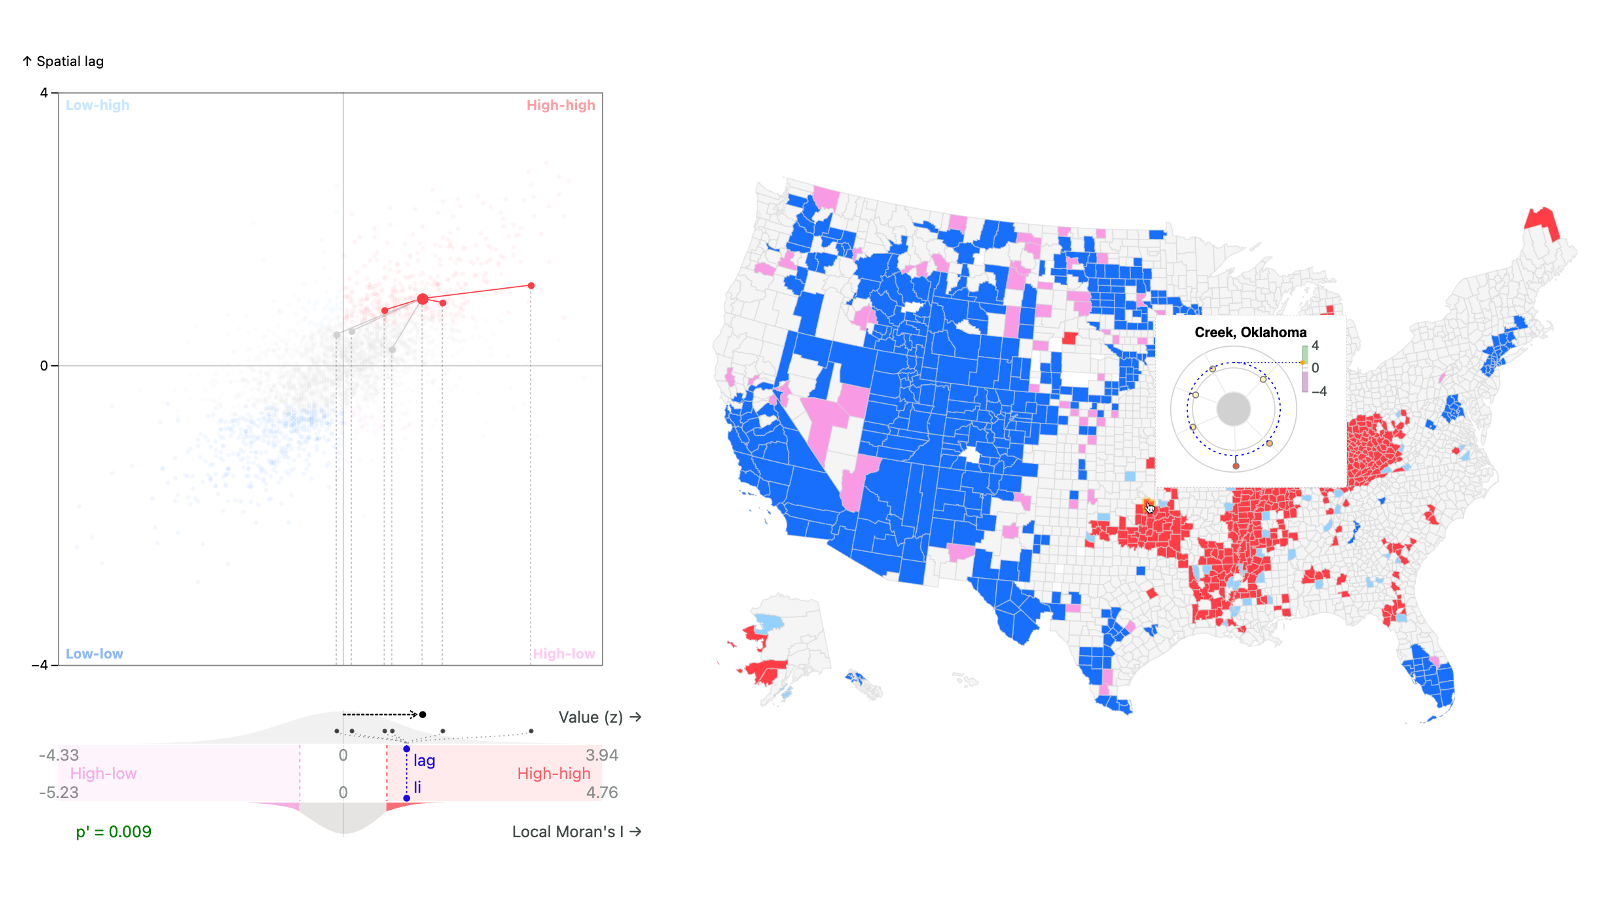
The Local Moran's I statistic is a valuable tool for identifying localized patterns of spatial autocorrelation. Understanding these patterns is crucial in spatial analysis, but interpreting the statistic can be difficult. To simplify this process, we introduce three novel visualizations that enhance the interpretation of Local Moran's I results. These visualizations can be interactively linked to one another, and to established visualizations, to offer a more holistic exploration of the results. We provide a JavaScript library with implementations of these new visual elements, along with a web dashboard that demonstrates their integrated use.