Gridlines Mitigate Sine Illusion in Line Charts
Clayton J Knittel - Google LLC, San Francisco, United States
Jane Awuah - Georgia Institute of Technology, Atlanta, United States
Steven L Franconeri - Northwestern University, Evanston, United States
Cindy Xiong Bearfield - Georgia Tech, Atlanta, United States
Screen-reader Accessible PDF
Download preprint PDF
Download Supplemental Material
Room: Bayshore VI
2024-10-17T13:33:00ZGMT-0600Change your timezone on the schedule page
2024-10-17T13:33:00Z

Fast forward
Full Video
Keywords
sine illusion, gridlines, perception, bias, thresholds
Abstract
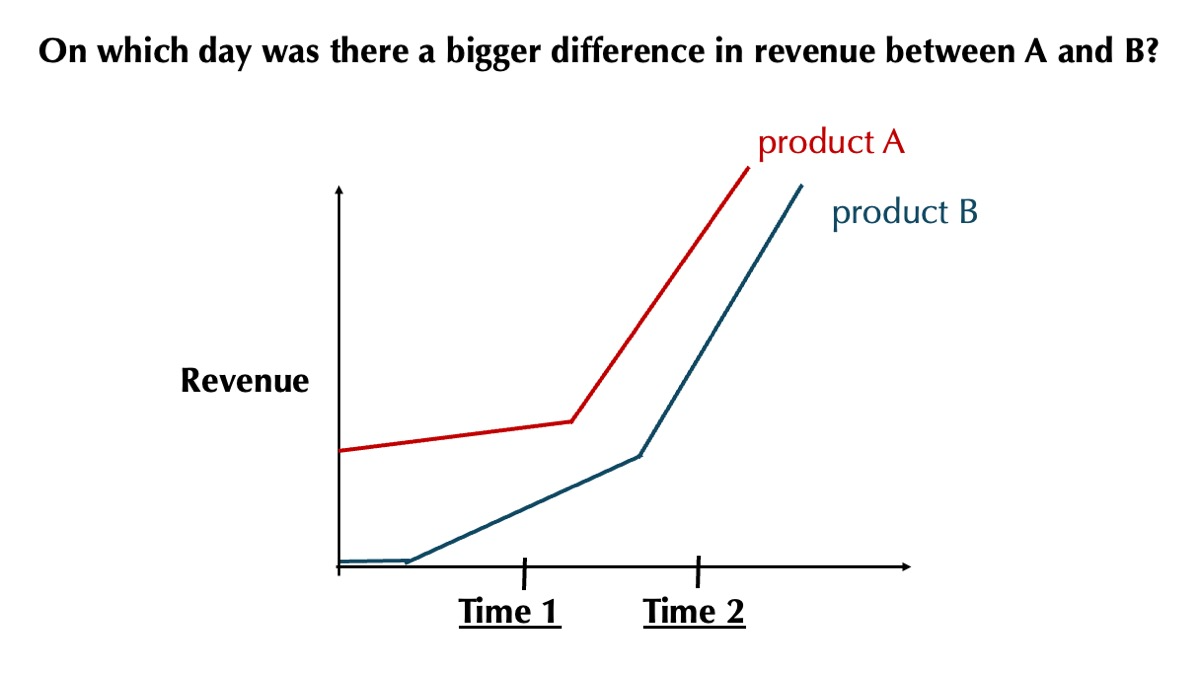
Sine illusion happens when the more quickly changing pairs of lines lead to bigger underestimates of the delta between them.We evaluate three visual manipulations on mitigating sine illusions: dotted lines, aligned gridlines, and offset gridlines via a user study. We asked participants to compare the deltas between two lines at two time points and found aligned gridlines to be the most effective in mitigating sine illusions.Using data from the user study, we produced a model that predicts the impact of the sine illusion in line charts by accounting for the ratio of the vertical distance between the two points of comparison. When the ratio is less than 50\%, participants begin to be influenced by the sine illusion. This effect can be significantly exacerbated when the difference between the two deltas falls under 30\%.We compared two explanations for the sine illusion based on our data: either participants were mistakenly using the perpendicular distance between the two lines to make their comparison (the perpendicular explanation), or they incorrectly relied on the length of the line segment perpendicular to the angle bisector of the bottom and top lines (the equal triangle explanation). We found the equal triangle explanation to be the more predictive model explaining participant behaviors.