The Impact of Vertical Scaling on Normal Probability Density Function Plots
Racquel Fygenson - Northeastern University, Boston, United States
Lace M. Padilla - Northeastern University, Boston, United States
Screen-reader Accessible PDF
Download preprint PDF
Download Supplemental Material
Room: Bayshore II
2024-10-16T16:00:00ZGMT-0600Change your timezone on the schedule page
2024-10-16T16:00:00Z
Fast forward
Full Video
Keywords
visualization, probability density function, uncertainty, vertical scaling, perception, area chart
Abstract
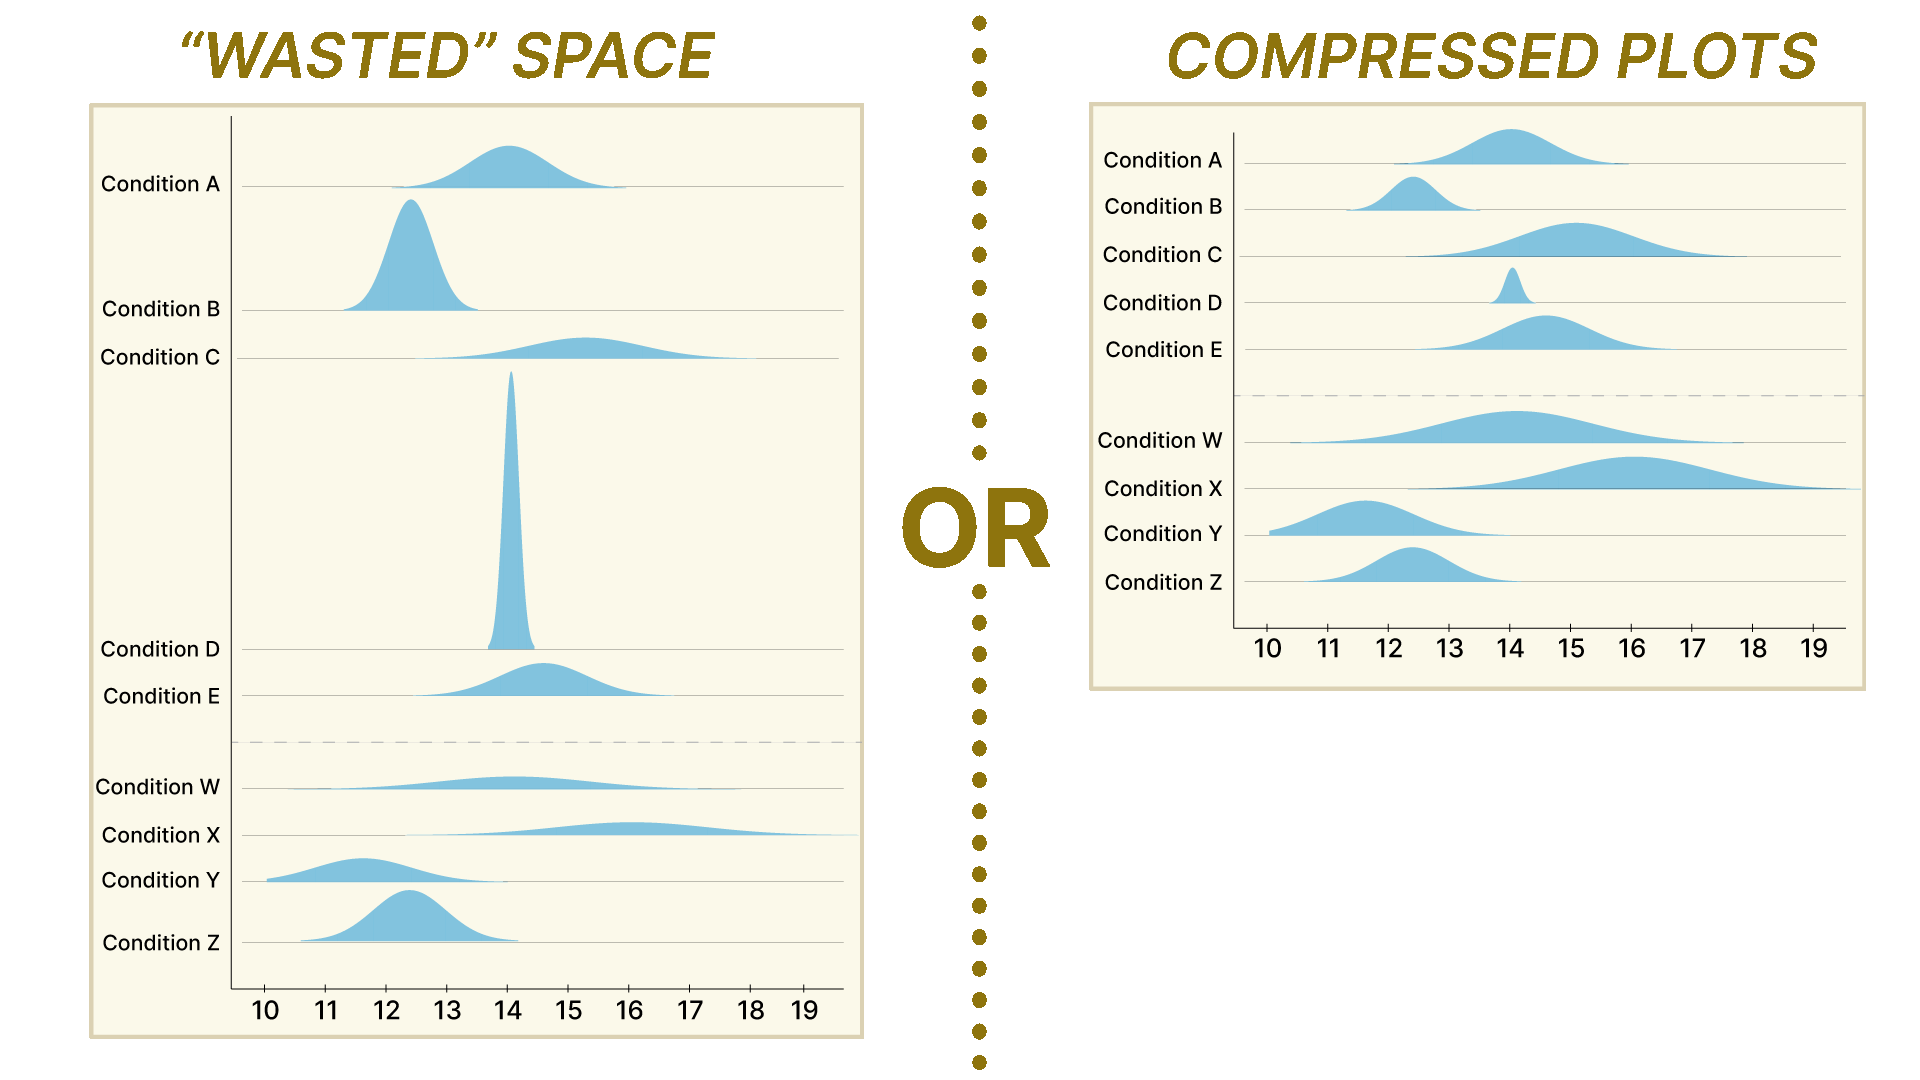
Probability density function (PDF) curves are among the few charts on a Cartesian coordinate system that are commonly presented without y-axes. This design decision may be due to the lack of relevance of vertical scaling in normal PDFs. In fact, as long as two normal PDFs have the same means and standard deviations (SDs), they can be scaled to occupy different amounts of vertical space while still remaining statistically identical. Because unfixed PDF height increases as SD decreases, visualization designers may find themselves tempted to vertically shrink low-SD PDFs to avoid occlusion or save white space in their figures. Although irregular vertical scaling has been explored in bar and line charts, the visualization community has yet to investigate how this visual manipulation may affect reader comparisons of PDFs. In this paper, we present two preregistered experiments (n = 600, n = 401) that systematically demonstrate that vertical scaling can lead to misinterpretations of PDFs. We also test visual interventions to mitigate misinterpretation. In some contexts, we find including a y-axis can help reduce this effect. Overall, we find that keeping vertical scaling consistent, and therefore maintaining equal pixel areas under PDF curves, results in the highest likelihood of accurate comparisons. Our findings provide insights into the impact of vertical scaling on PDFs, and reveal the complicated nature of proportional area comparisons.