Who Let the Guards Out: Visual Support for Patrolling Games
Matěj Lang - Masaryk University, Brno, Czech Republic
Adam Štěpánek - Masaryk University, Brno, Czech Republic
Róbert Zvara - Faculty of Informatics, Masaryk University, Brno, Czech Republic
Vojtěch Řehák - Faculty of Informatics, Masaryk University, Brno, Czech Republic
Barbora Kozlikova - Masaryk University, Brno, Czech Republic
Room: Bayshore V
2024-10-17T15:15:00ZGMT-0600Change your timezone on the schedule page
2024-10-17T15:15:00Z

Fast forward
Full Video
Keywords
Patrolling Games, Strategy, Graph, Heatmap, Visual Analysis
Abstract
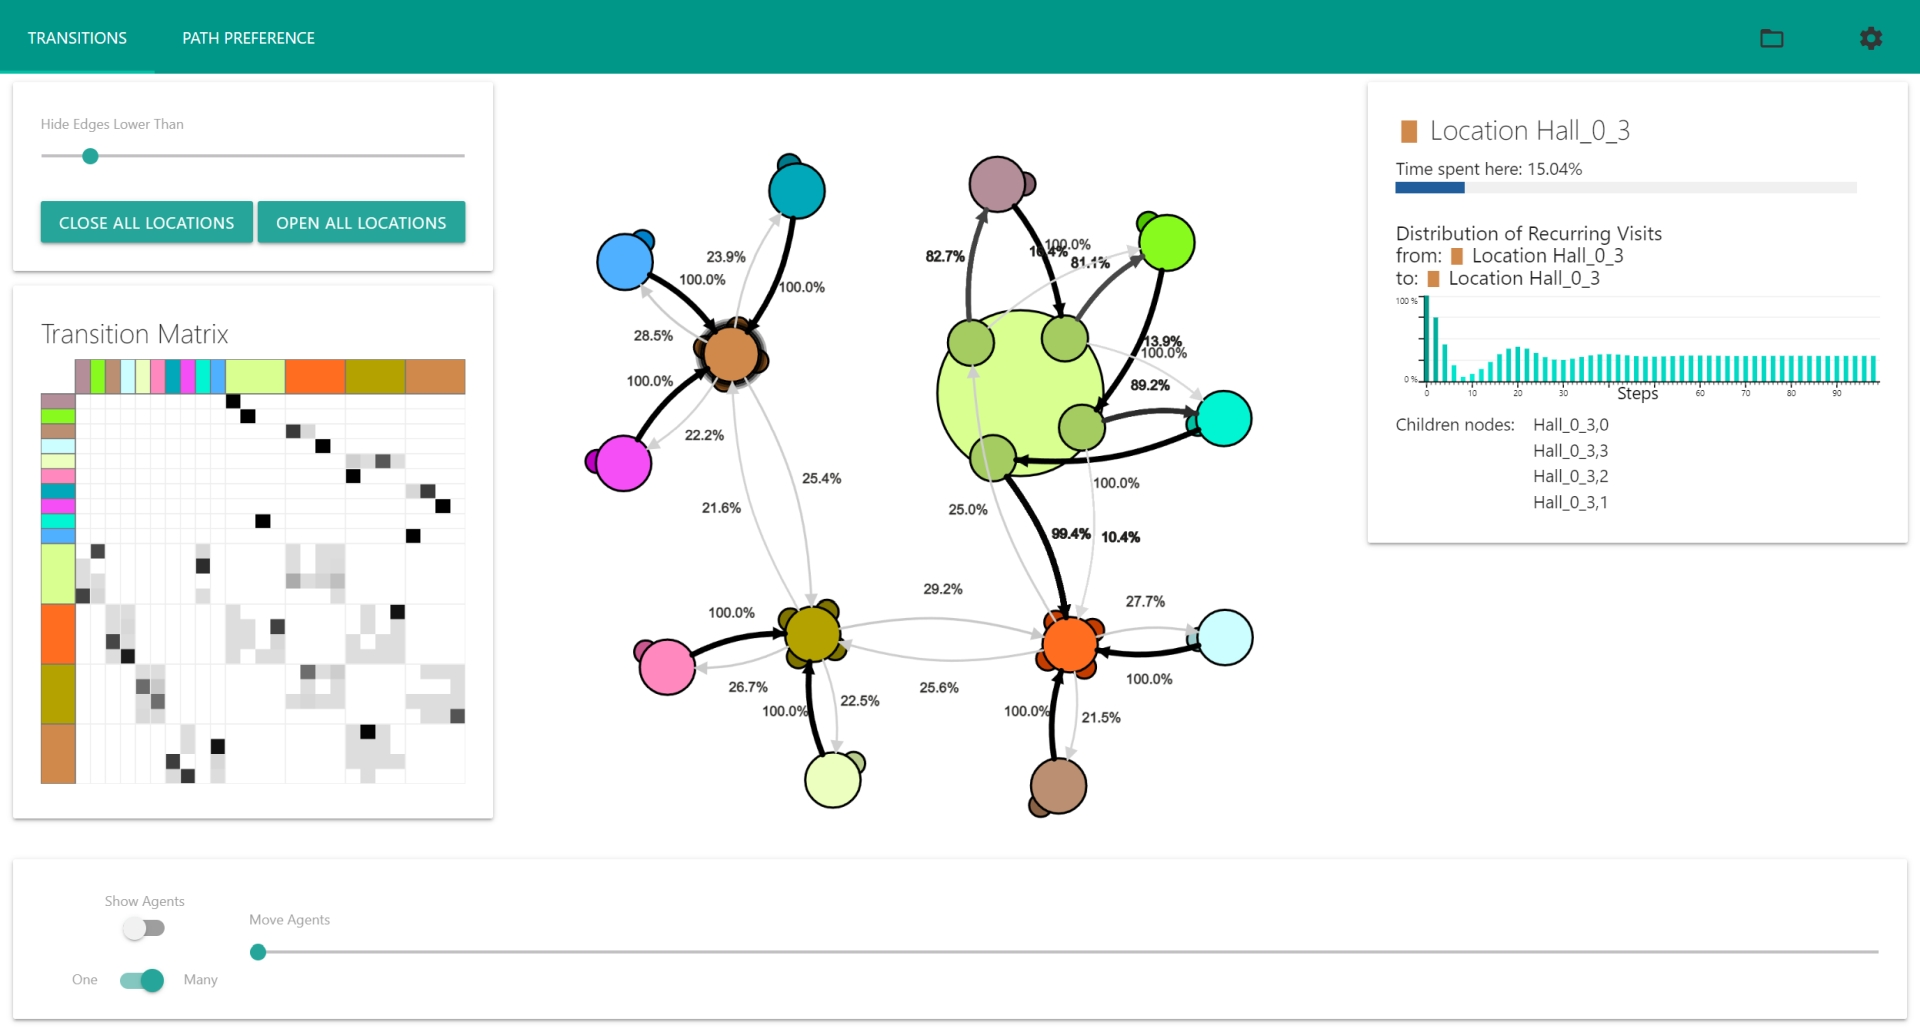
Effective security patrol management is critical for ensuring safety in diverse environments such as art galleries, airports, and factories. The behavior of patrols in these situations can be modeled by patrolling games. They simulate the behavior of the patrol and adversary in the building, which is modeled as a graph of interconnected nodes representing rooms. The designers of algorithms solving the game face the problem of analyzing complex graph layouts with temporal dependencies. Therefore, appropriate visual support is crucial for them to work effectively. In this paper, we present a novel tool that helps the designers of patrolling games explore the outcomes of the proposed algorithms and approaches, evaluate their success rate, and propose modifications that can improve their solutions. Our tool offers an intuitive and interactive interface, featuring a detailed exploration of patrol routes and probabilities of taking them, simulation of patrols, and other requested features. In close collaboration with experts in designing patrolling games, we conducted three case studies demonstrating the usage and usefulness of our tool. The prototype of the tool, along with exemplary datasets, is available at https://gitlab.fi.muni.cz/formela/strategy-vizualizer.