DG Comics: Semi-Automatically Authoring Graph Comics for Dynamic Graphs
Joohee Kim - Ulsan National Institute of Science and Technology, Ulsan, Korea, Republic of
Hyunwook Lee - Ulsan National Institute of Science and Technology, Ulsan, Korea, Republic of
Duc M. Nguyen - Ulsan National Institute of Science and Technology, Ulsan, Korea, Republic of
Minjeong Shin - Australian National University, Canberra, Australia
Bum Chul Kwon - IBM Research, Cambridge, United States
Sungahn Ko - UNIST, Ulsan, Korea, Republic of
Niklas Elmqvist - Aarhus University, Aarhus, Denmark
Download preprint PDF
Room: Bayshore V
2024-10-17T17:00:00ZGMT-0600Change your timezone on the schedule page
2024-10-17T17:00:00Z
Fast forward
Full Video
Keywords
Data-driven storytelling, narrative visualization, dynamic graphs, graph comics
Abstract
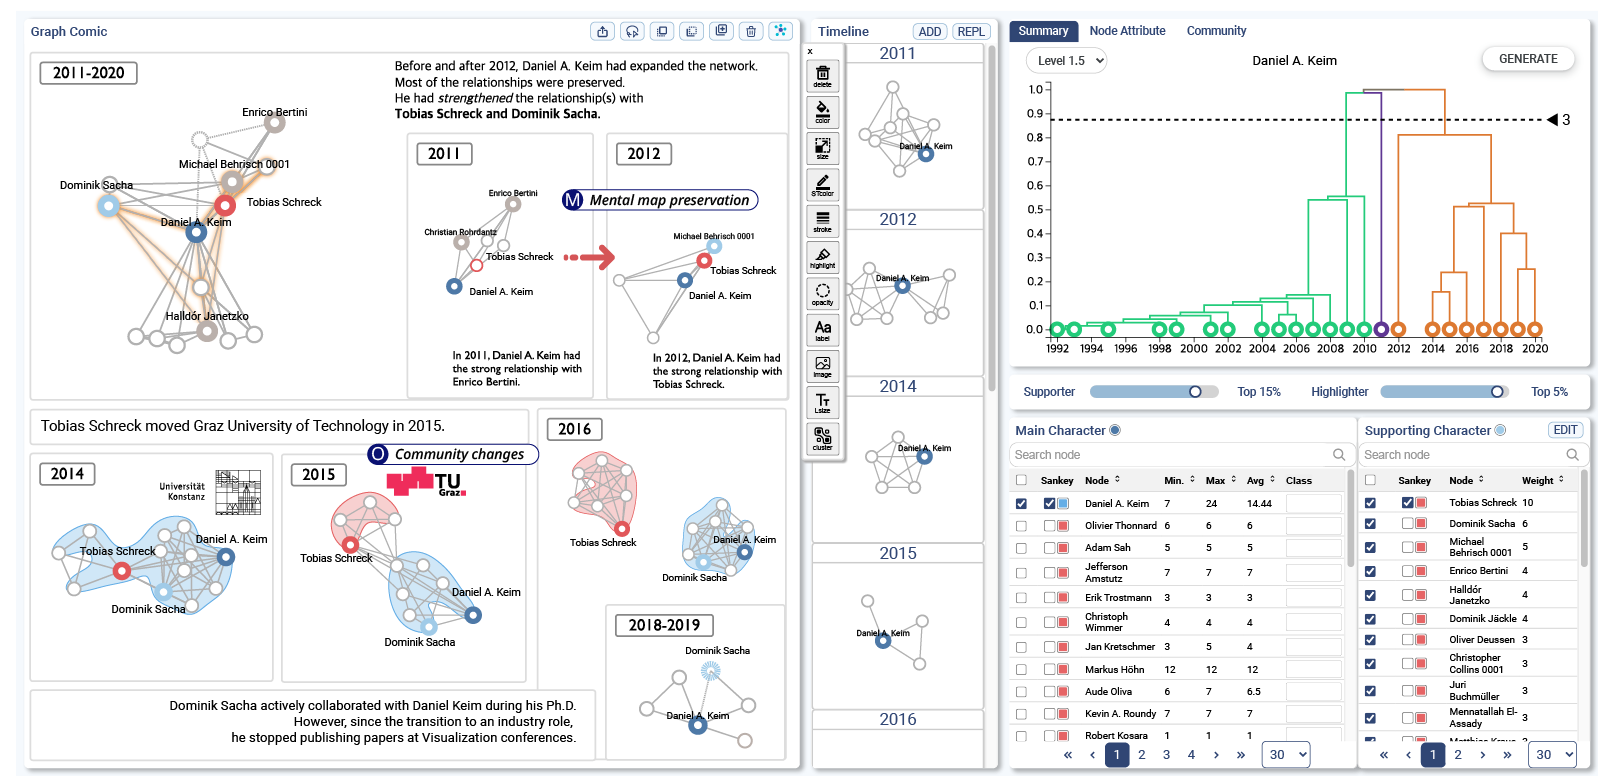
Comics are an effective method for sequential data-driven storytelling, especially for dynamic graphs—graphs whose vertices and edges change over time. However, manually creating such comics is currently time-consuming, complex, and error-prone. In this paper, we propose DG Comics, a novel comic authoring tool for dynamic graphs that allows users to semi-automatically build and annotate comics. The tool uses a newly developed hierarchical clustering algorithm to segment consecutive snapshots of dynamic graphs while preserving their chronological order. It also presents rich information on both individuals and communities extracted from dynamic graphs in multiple views, where users can explore dynamic graphs and choose what to tell in comics. For evaluation, we provide an example and report the results of a user study and an expert review.