Understanding Visualization Authoring Techniques for Genomics Data in the Context of Personas and Tasks
Astrid van den Brandt - Eindhoven University of Technology, Eindhoven, Netherlands
Sehi L'Yi - Harvard Medical School, Boston, United States
Huyen N. Nguyen - Harvard Medical School, Boston, United States
Anna Vilanova - Eindhoven University of Technology, Eindhoven, Netherlands
Nils Gehlenborg - Harvard Medical School, Boston, United States
Download preprint PDF
Download Supplemental Material
Room: Bayshore II
2024-10-17T17:00:00ZGMT-0600Change your timezone on the schedule page
2024-10-17T17:00:00Z

Fast forward
Full Video
Keywords
User interviews, visual probes, visualization authoring, genomics data visualization
Abstract
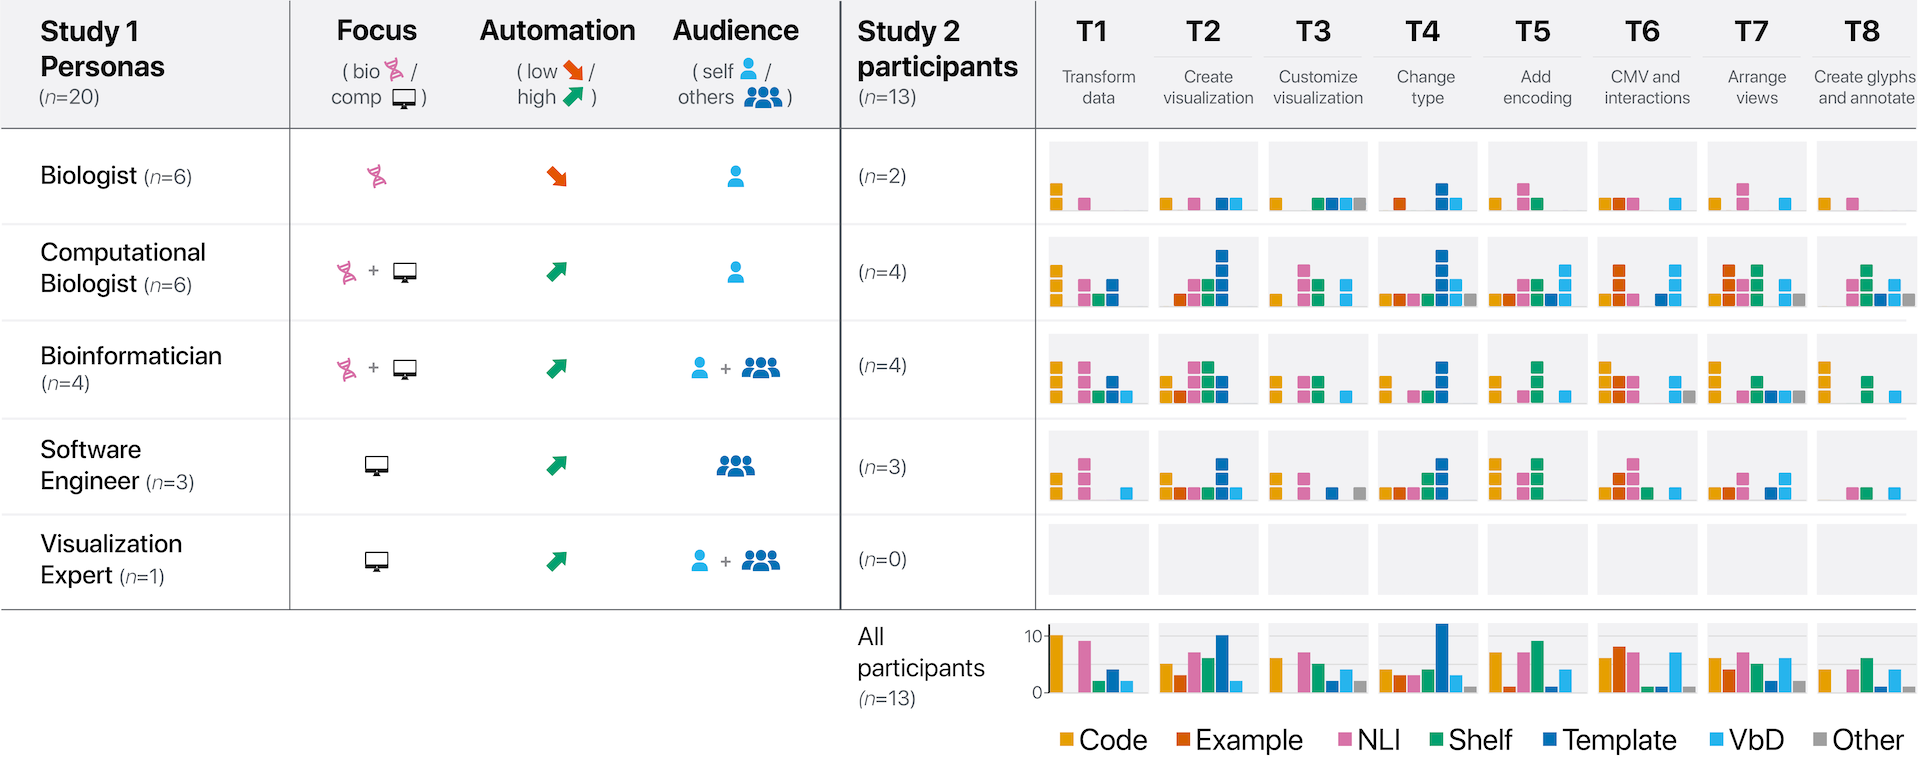
Genomics experts rely on visualization to extract and share insights from complex and large-scale datasets. Beyond off-the-shelf tools for data exploration, there is an increasing need for platforms that aid experts in authoring customized visualizations for both exploration and communication of insights. A variety of interactive techniques have been proposed for authoring data visualizations, such as template editing, shelf configuration, natural language input, and code editors. However, it remains unclear how genomics experts create visualizations and which techniques best support their visualization tasks and needs. To address this gap, we conducted two user studies with genomics researchers: (1) semi-structured interviews (n=20) to identify the tasks, user contexts, and current visualization authoring techniques and (2) an exploratory study (n=13) using visual probes to elicit users’ intents and desired techniques when creating visualizations. Our contributions include (1) a characterization of how visualization authoring is currently utilized in genomics visualization, identifying limitations and benefits in light of common criteria for authoring tools, and (2) generalizable design implications for genomics visualization authoring tools based on our findings on task- and user-specific usefulness of authoring techniques. All supplemental materials are available at https://osf.io/bdj4v/.