Quantifying Emotional Responses to Immutable Data Characteristics and Designer Choices in Data Visualizations
Carter Blair - University of Waterloo, Waterloo, Canada. University of Victoria, Victoria, Canada
Xiyao Wang - University of Victoria, Victoira, Canada. Delft University of Technology, Delft, Netherlands
Charles Perin - University of Victoria, Victoria, Canada
Download preprint PDF
Download Supplemental Material
Room: Bayshore II
2024-10-16T16:24:00ZGMT-0600Change your timezone on the schedule page
2024-10-16T16:24:00Z
Fast forward
Full Video
Keywords
Affect, Data Visualization, Emotion, Quantitative Study
Abstract
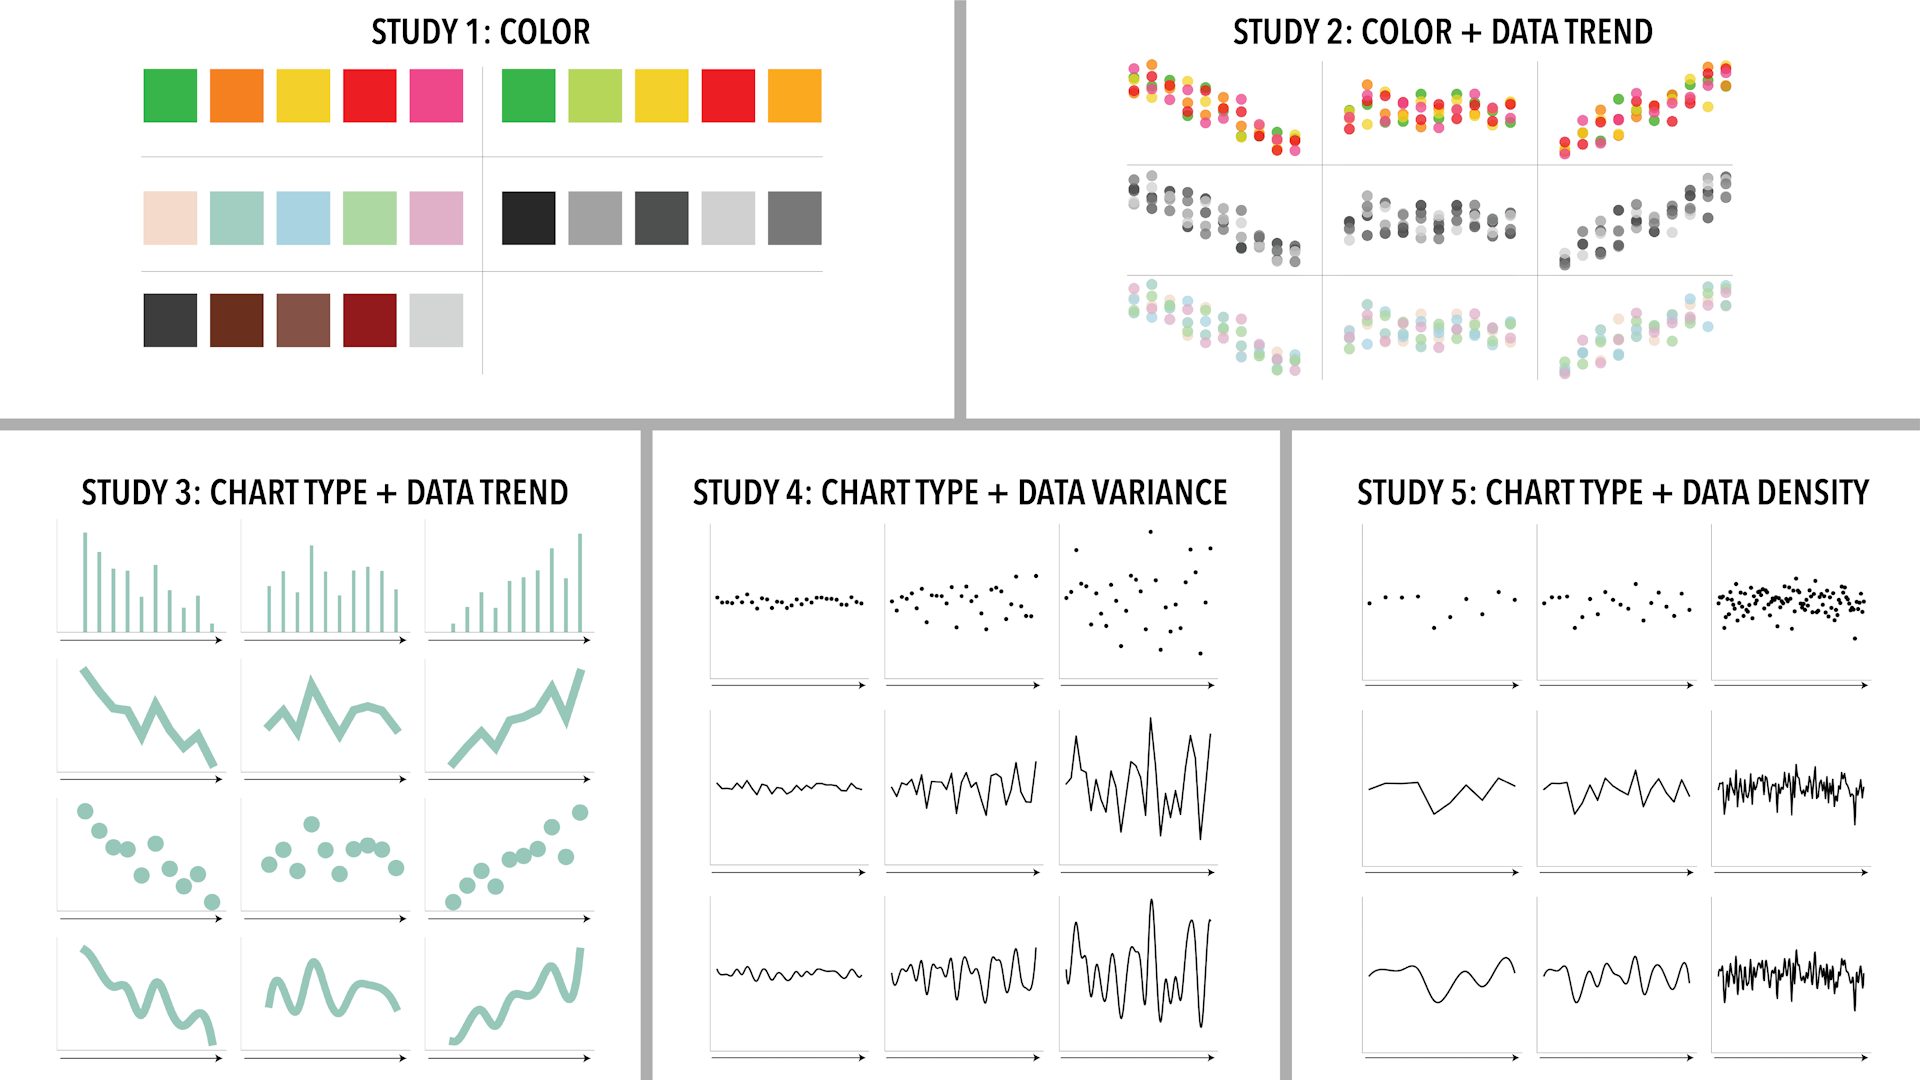
Emotion is an important factor to consider when designing visualizations as it can impact the amount of trust viewers place in a visualization, how well they can retrieve information and understand the underlying data, and how much they engage with or connect to a visualization. We conducted five crowdsourced experiments to quantify the effects of color, chart type, data trend, data variability and data density on emotion (measured through self-reported arousal and valence). Results from our experiments show that there are multiple design elements which influence the emotion induced by a visualization and, more surprisingly, that certain data characteristics influence the emotion of viewers even when the data has no meaning. In light of these findings, we offer guidelines on how to use color, scale, and chart type to counterbalance and emphasize the emotional impact of immutable data characteristics.