DiffSeer: Difference-Based Dynamic Weighted Graph Visualization
Xiaolin Wen -
Yong Wang -
Meixuan Wu -
Fengjie Wang -
Xuanwu Yue -
Qiaomu Shen -
Yuxin Ma -
Min Zhu -
Download preprint PDF
Access paper PDF
DOI: 10.1109/MCG.2023.3248289
Room: Bayshore III
2024-10-17T16:00:00ZGMT-0600Change your timezone on the schedule page
2024-10-17T16:00:00Z
Fast forward
Full Video
Keywords
Visibility Graph, Spatial Patterns, Weight Change, In-depth Interviews, Temporal Changes, Temporal Evolution, Negative Changes, Interesting Patterns, Edge Weights, Real-world Datasets, Graph Structure, Visual Approach, Dynamic Visualization, Dynamic Graph, Financial Networks, Graph Datasets, Similar Evolutionary Patterns, User Interviews, Similar Changes, Chinese New Year, Sector Indices, Original Graph, Red Rectangle, Nodes In Order, Stock Market Crash, Stacked Bar Charts, Different Types Of Matrices, Chinese New, Blue Rectangle
Abstract
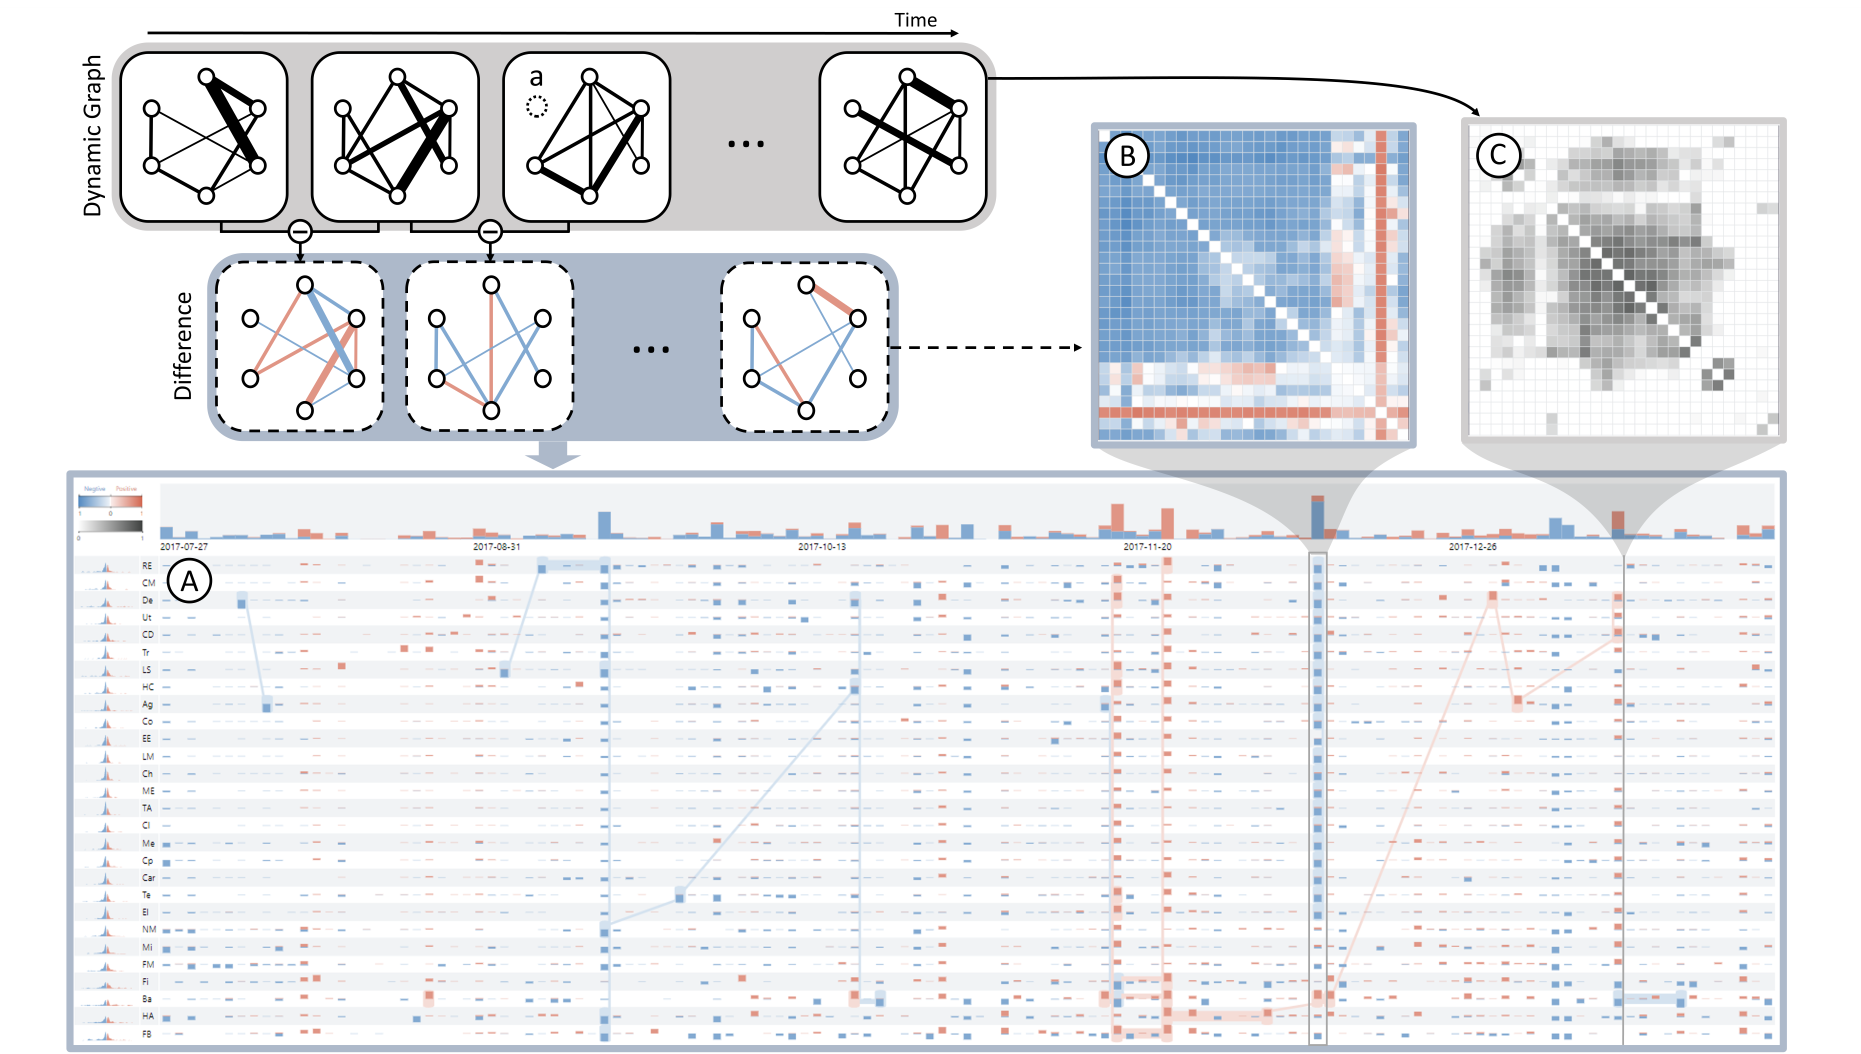
Existing dynamic weighted graph visualization approaches rely on users’ mental comparison to perceive temporal evolution of dynamic weighted graphs, hindering users from effectively analyzing changes across multiple timeslices. We propose DiffSeer, a novel approach for dynamic weighted graph visualization by explicitly visualizing the differences of graph structures (e.g., edge weight differences) between adjacent timeslices. Specifically, we present a novel nested matrix design that overviews the graph structure differences over a time period as well as shows graph structure details in the timeslices of user interest. By collectively considering the overall temporal evolution and structure details in each timeslice, an optimization-based node reordering strategy is developed to group nodes with similar evolution patterns and highlight interesting graph structure details in each timeslice. We conducted two case studies on real-world graph datasets and in-depth interviews with 12 target users to evaluate DiffSeer. The results demonstrate its effectiveness in visualizing dynamic weighted graphs.