X-Raying a Research Institute: An interactive visual analytics system for exploring a research center's teams, topics, and collaborations over time
Olha Baliasina (Inria Saclay), Petra Isenberg (Université Paris-Saclay, CNRS, Inria, LISN), Jean-Daniel Fekete (Université Paris-Saclay, CNRS, Inria)

Links
Sign in to access the Paper PDF.
Abstract
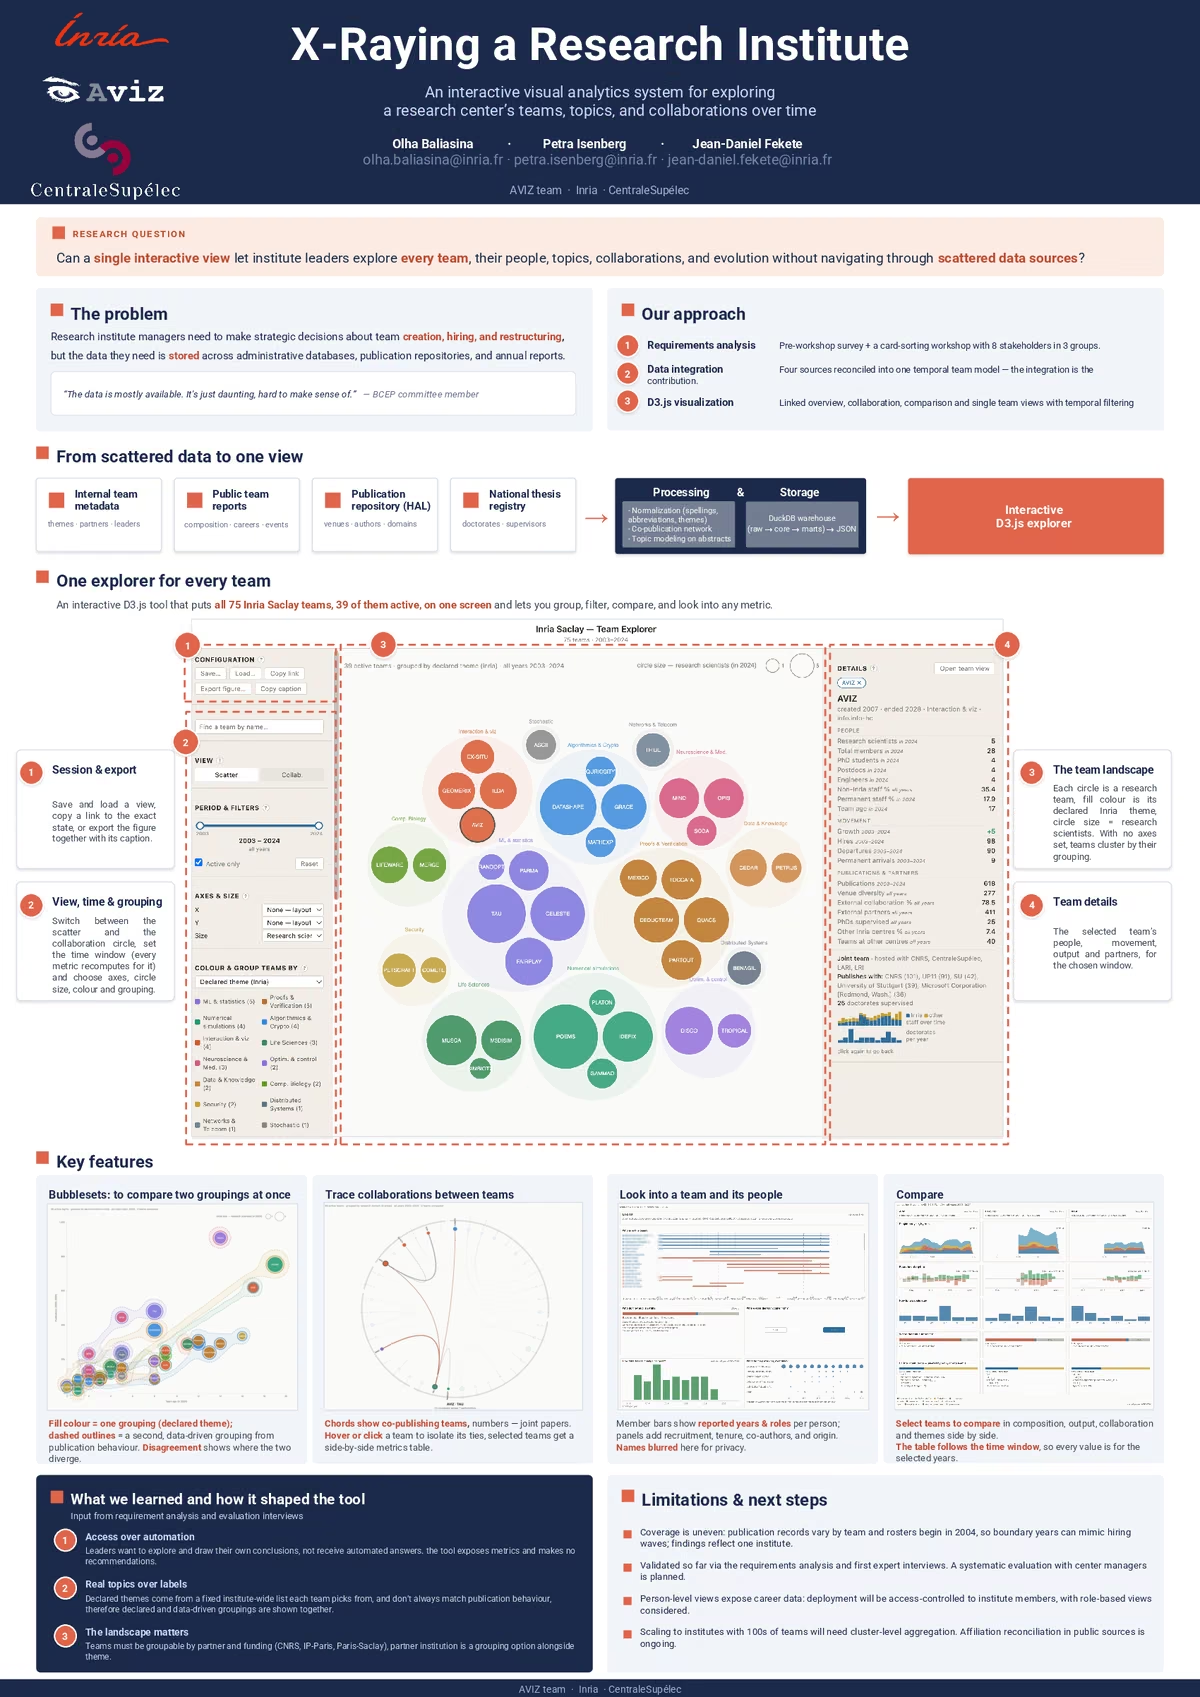
We present a visual analytics system for exploring data about research teams at a public French research institute. Research institute managers need to make strategic decisions about team creation, hiring, and restructuring, but the data they need is scattered across administrative databases, publication repositories, and annual reports. Our tool is ultimately meant to help managers make these decisions, but can also support communication about the institute more broadly. We conducted a requirements analysis with eight members of a center management committee. Based on these requirements, we integrate four data sources, compute data-driven research profiles from publication venues, and provide linked views with temporal filtering and bubble-set overlays. We describe the tool design, its data pipeline, and the findings from our requirements analysis.