From Graphs to Words: A Computer-Assisted Framework for the Production of Accessible Text Descriptions
Qiang Xu - Polytechnique Montréal, Montréal, Canada
Thomas Hurtut - Polytechnique Montreal, Montreal, Canada
Room: Palma Ceia I
2024-10-16T13:03:00ZGMT-0600Change your timezone on the schedule page
2024-10-16T13:03:00Z

Fast forward
Full Video
Keywords
Accessibility, chart text description.
Abstract
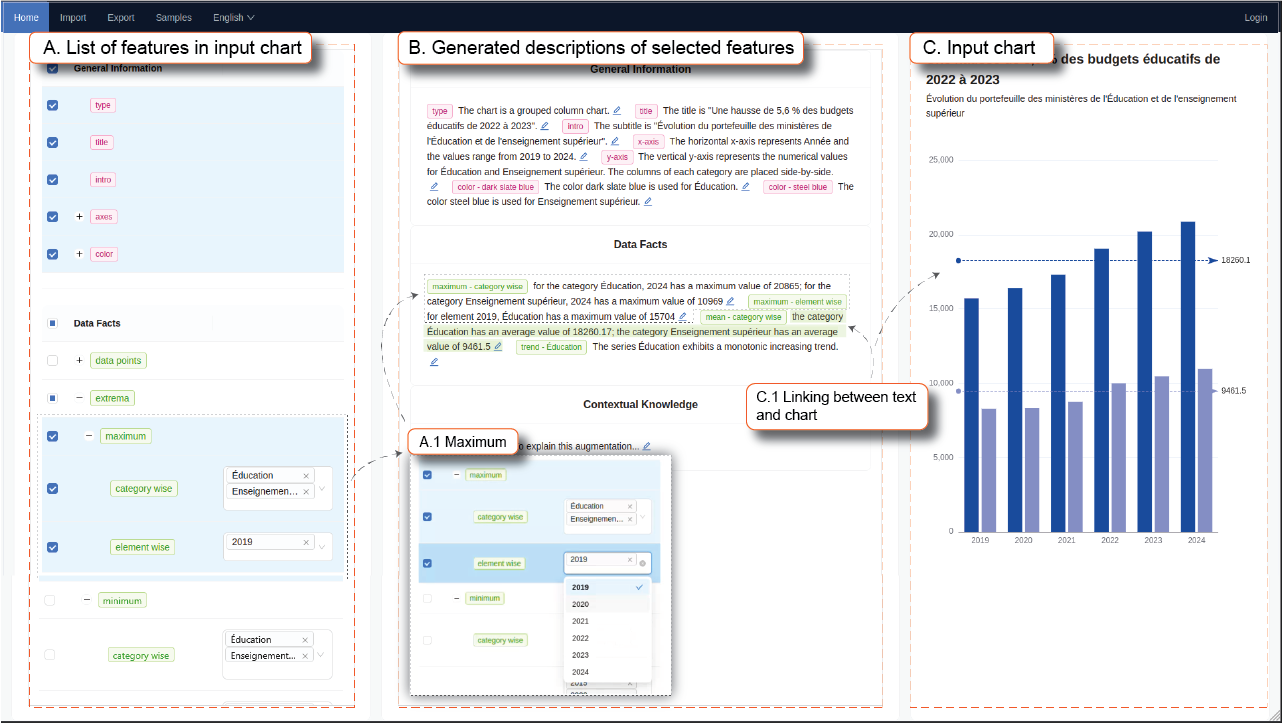
In the digital landscape, the ubiquity of data visualizations in media underscores the necessity for accessibility to ensure inclusivity for all users, including those with visual impairments. Current visual content often fails to cater to the needs of screen reader users due to the absence of comprehensive textual descriptions. To address this gap, we propose in this paper a framework designed to empower media content creators to transform charts into descriptive narratives. This tool not only facilitates the understanding of complex visual data through text but also fosters a broader awareness of accessibility in digital content creation. Through the application of this framework, users can interpret and convey the insights of data visualizations more effectively, accommodating a diverse audience. Our evaluations reveal that this tool not only enhances the comprehension of data visualizations but also promotes new perspectives on the represented data, thereby broadening the interpretative possibilities for all users.