Best Paper Award
PyGWalker: On-the-fly Assistant for Exploratory Visual Data Analysis
Yue Yu - The Hong Kong University of Science and Technology, Hong Kong, China. Kanaries Data Inc., Hangzhou, China
Leixian Shen - The Hong Kong University of Science and Technology, Hong Kong, China
Fei Long - Kanaries Data Inc., Hangzhou, China
Huamin Qu - The Hong Kong University of Science and Technology, Hong Kong, China
Hao Chen - Kanaries Data Inc., Hangzhou, China
Download preprint PDF
Room: Bayshore I + II + III
2024-10-15T15:21:00ZGMT-0600Change your timezone on the schedule page
2024-10-15T15:21:00Z

Fast forward
Full Video
Keywords
Data Visualization; Exploratory Data Analysis; Computational Notebooks
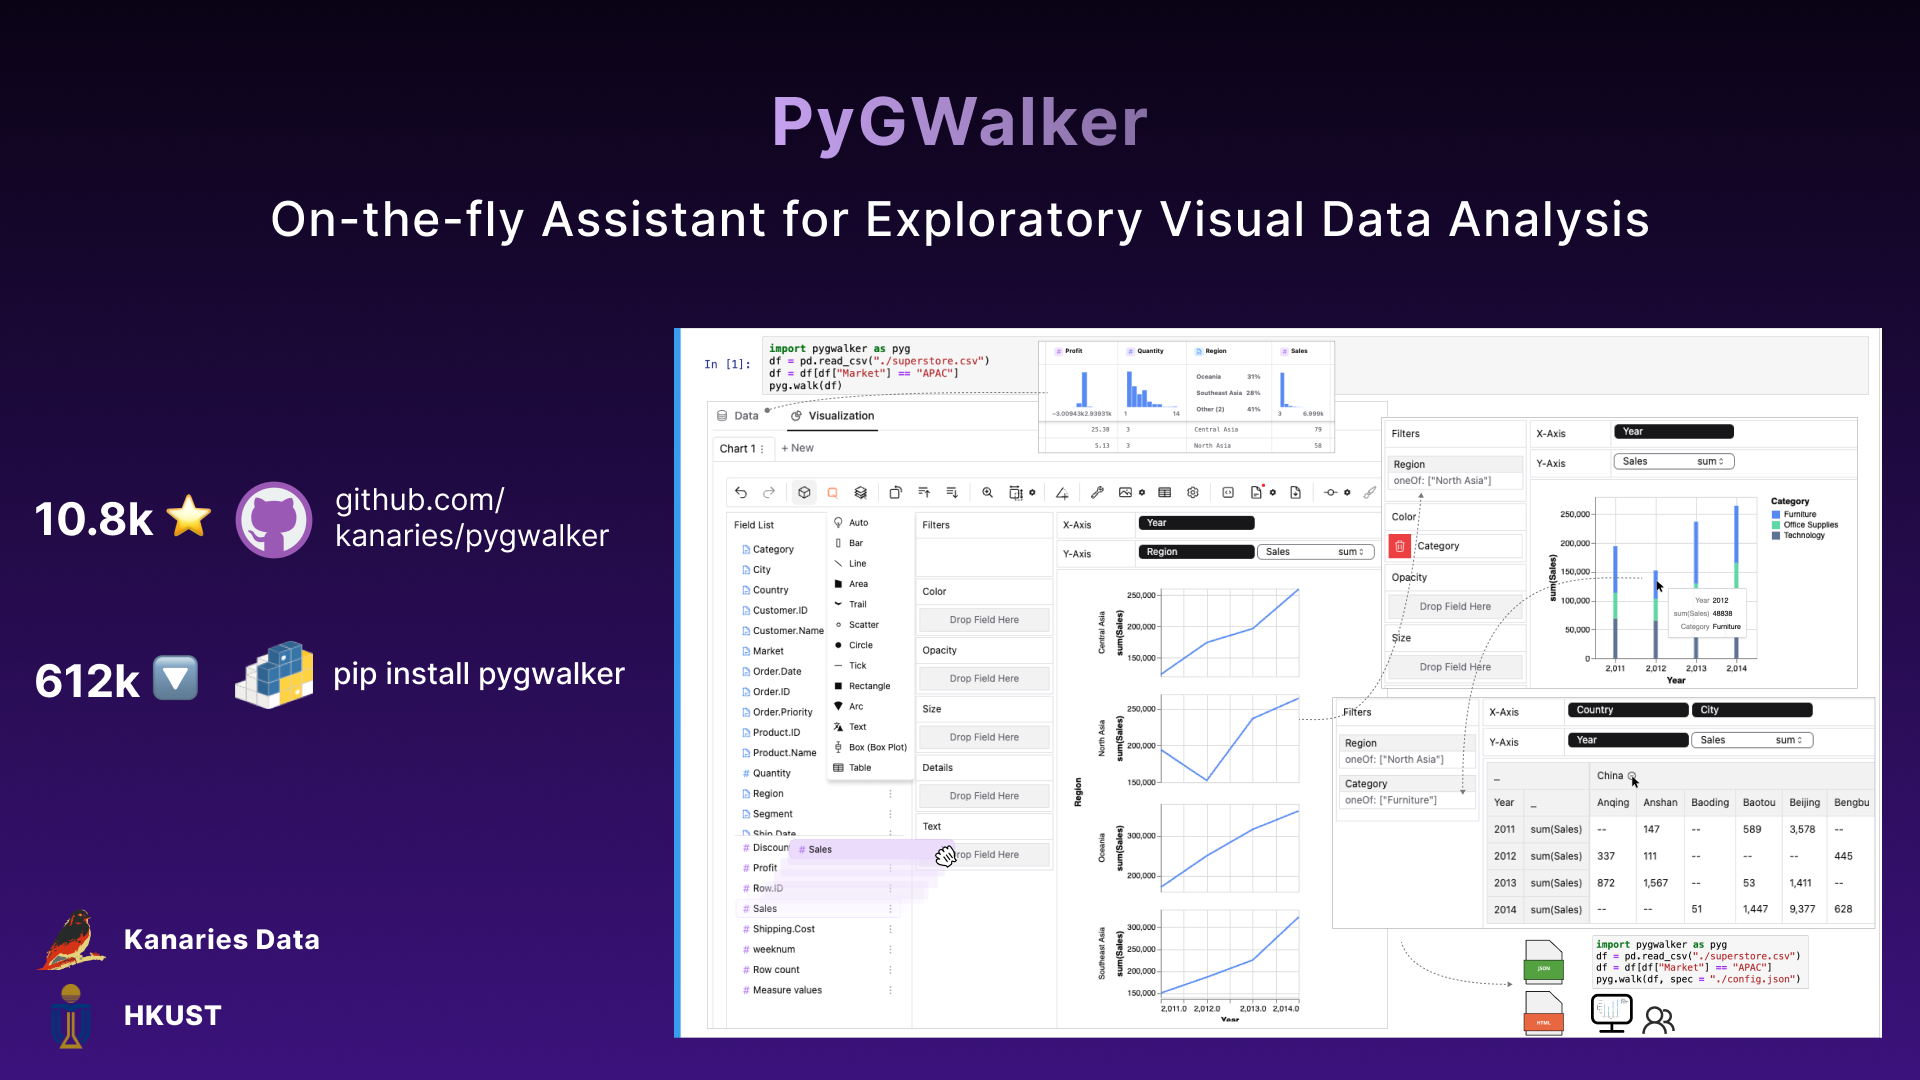
Abstract
Exploratory visual data analysis tools empower data analysts to efficiently and intuitively explore data insights throughout the entire analysis cycle. However, the gap between common programmatic analysis (e.g., within computational notebooks) and exploratory visual analysis leads to a disjointed and inefficient data analysis experience. To bridge this gap, we developed PyGWalker, a Python library that offers on-the-fly assistance for exploratory visual data analysis. It features a lightweight and intuitive GUI with a shelf builder modality. Its loosely coupled architecture supports multiple computational environments to accommodate varying data sizes. Since its release in February 2023, PyGWalker has gained much attention, with 612k downloads on PyPI and over 10.5k stars on GitHub as of June 2024. This demonstrates its value to the data science and visualization community, with researchers and developers integrating it into their own applications and studies.